

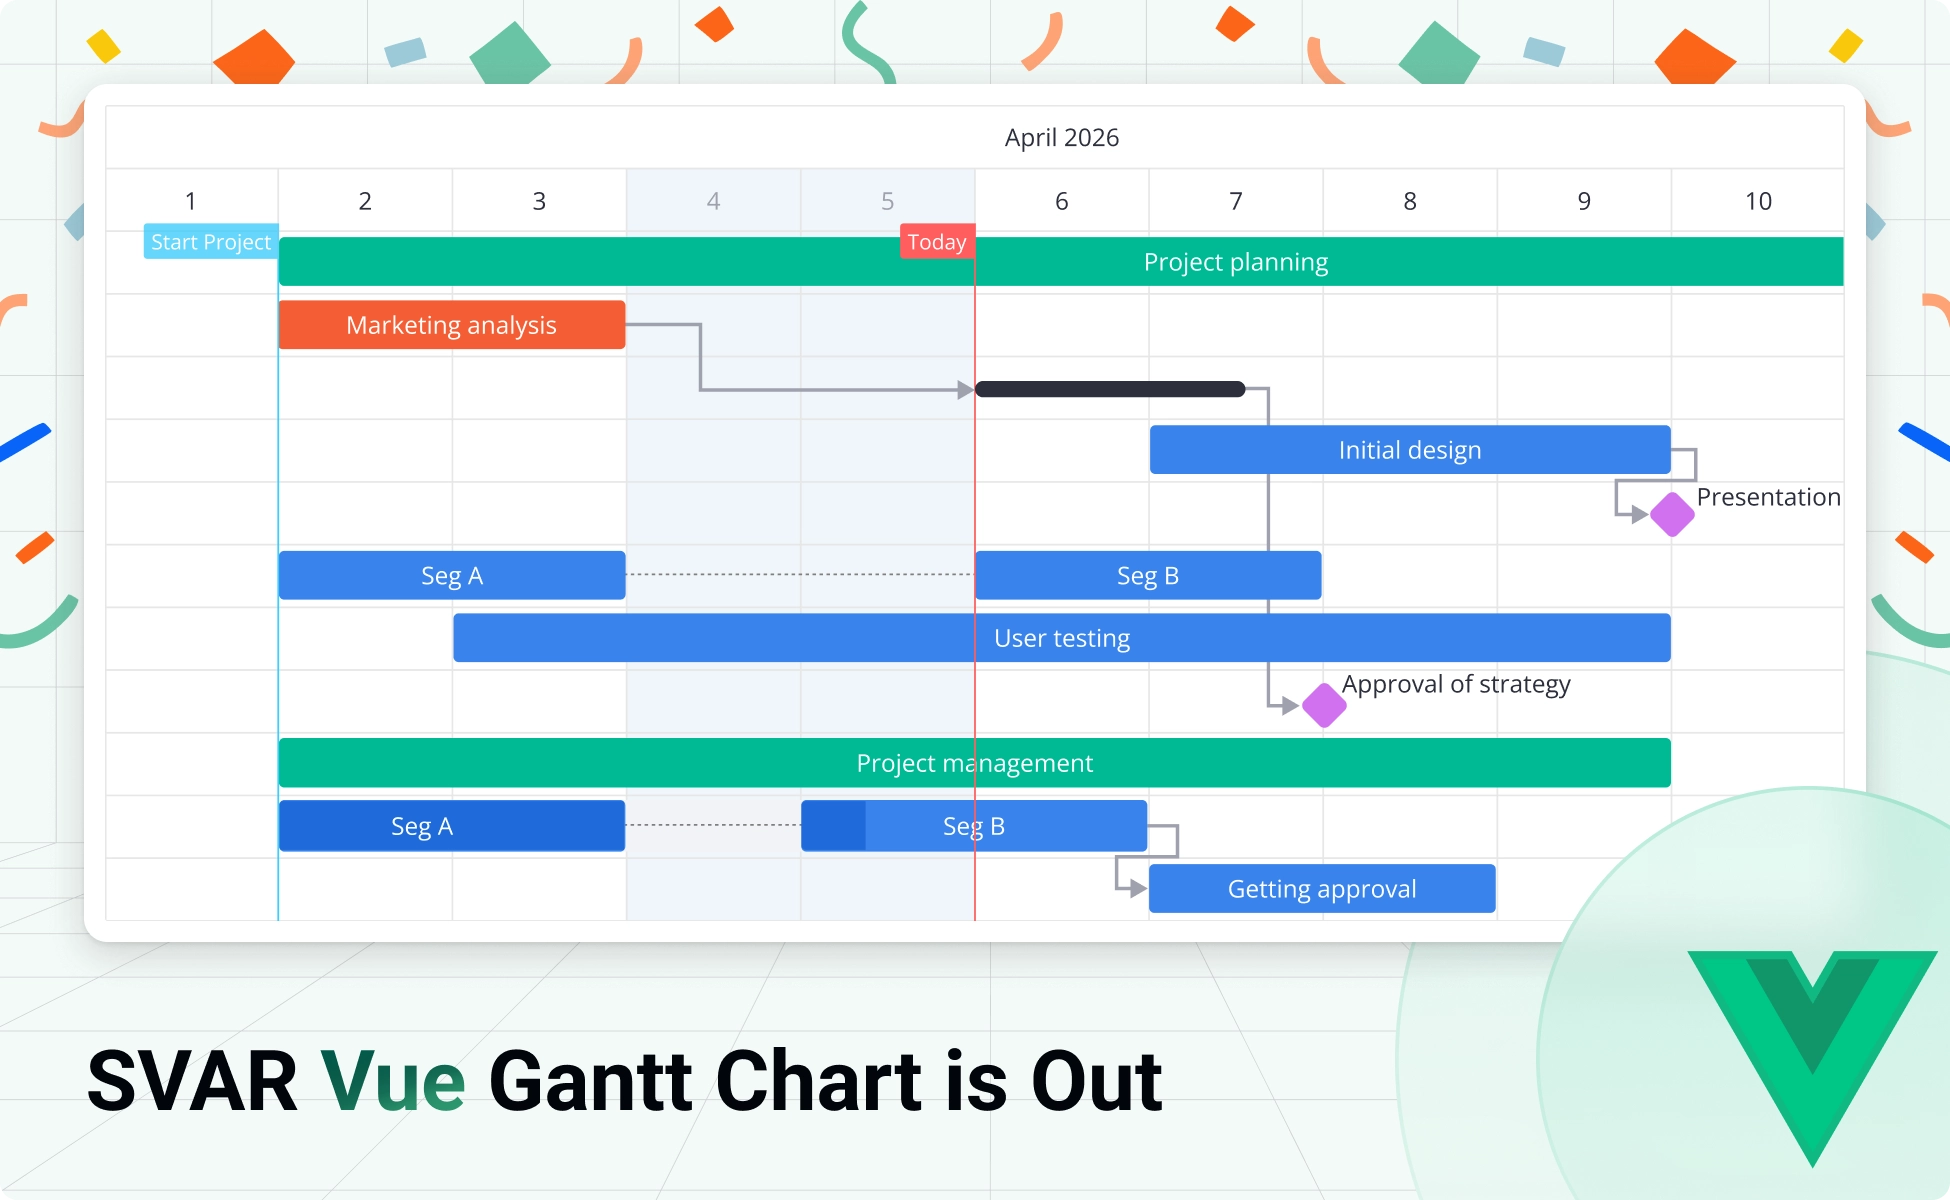
We’re excited to introduce SVAR Vue Gantt — a high-performance, rich-featured Gantt chart component built natively in Vue.js. It brings interactive project scheduling to your Vue 3 apps with a clean, developer-friendly API, an open-source core, and advanced PRO edition for complex, enterprise-level scheduling.
Get started right away:
- GitHub repo — give it a star if you like what you see ⭐
- Live demos
- Getting started guide
Install the open-source version via npm and build your first Gantt chart in minutes:
npm install @svar-ui/vue-ganttWhy SVAR Vue Gantt
The component covers what modern Gantt chart for project management requires out of the box:
- Task and dependency management
- Customizable UI: time scales, task bars, edit form, and more
- Tasks sorting, filtering
- Virtualization for large datasets
- Critical path & slack visualization (PRO)
- Baselines (PRO)
- Working time calendar (PRO)
- Auto-scheduling (PRO)
- Export to Excel, PNG, PDF, and MS Project import/export (PRO)
That said, let’s go through what makes it worth your attention.
What’s in the Core (Free, MIT-licensed)
The open-source edition of SVAR Vue Gantt is not a stripped-down demo. It’s a complete, production-ready component that handles the essentials of interactive project scheduling:
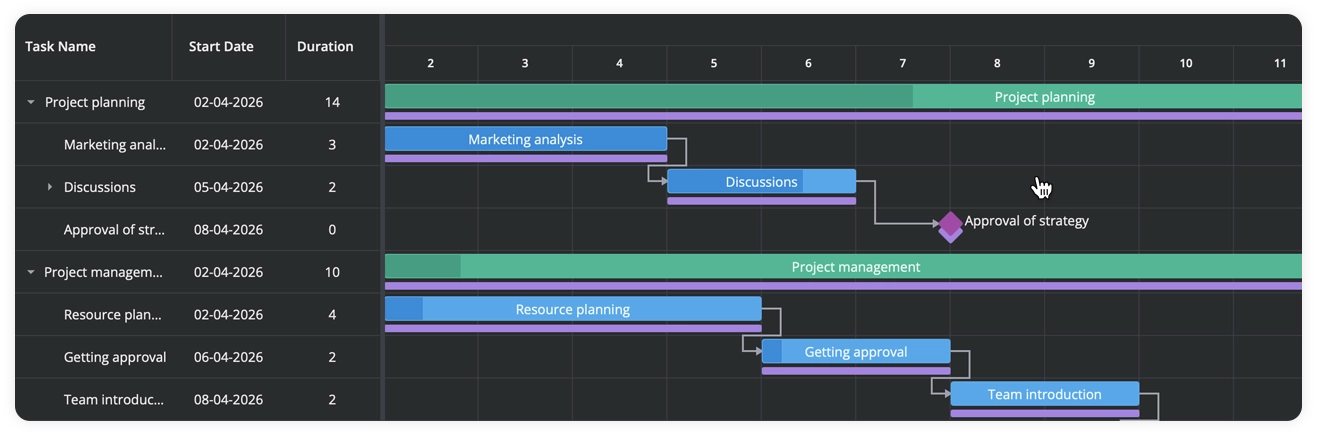
Drag-and-drop interface for task management
Users can manage tasks with the interactive timeline: reorder tasks in the grid, move and resize them on the timeline, and edit dependencies directly on the chart.
Customizable timelines and scales
You can configure time units from minutes to years, define custom scale lines, highlight weekends and holidays, and control scale width and boundaries. The timeline adapts to your project’s needs with a flexible Vue API.
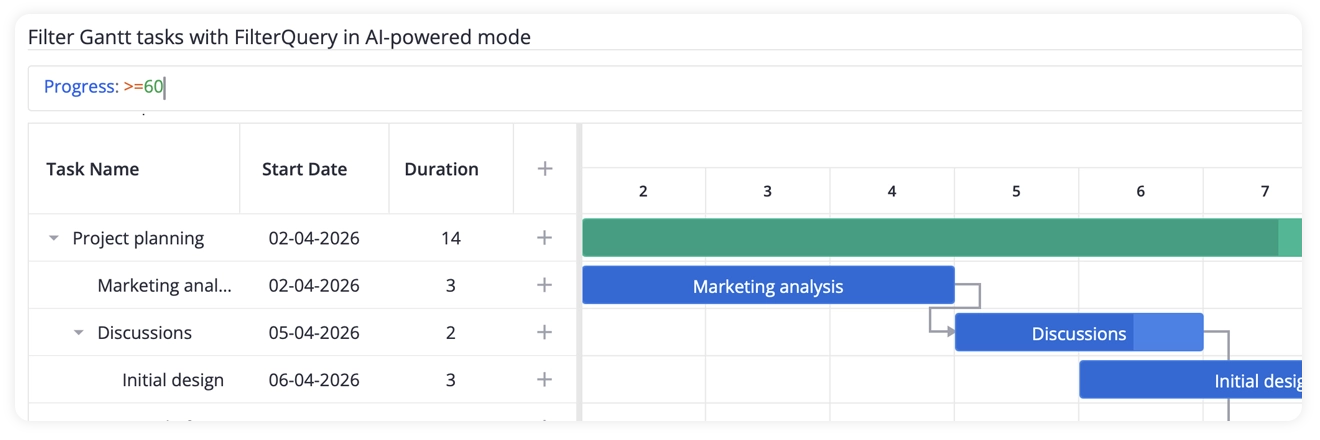
Sorting and filtering
SVAR Vue Gantt allows you to sort tasks by any column, apply header filters for quick data lookup, or plug in a query builder for advanced filtering via SVAR Vue Filter integration.
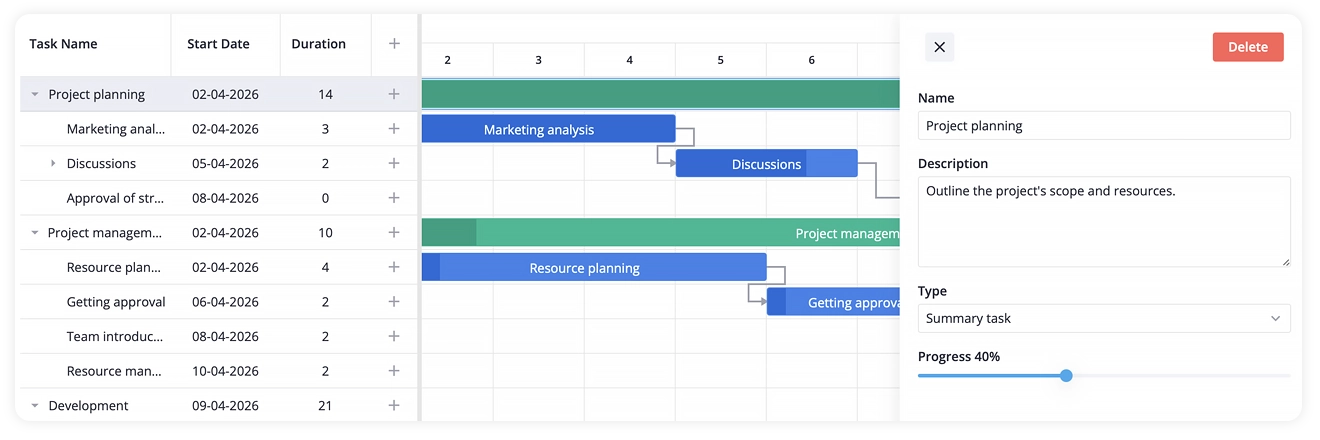
In-cell editing and standalone form
In addition to interactive timeline, tasks can be edited inline in the tasks grid with built-in editors or in a customizable edit form (integration with SVAR Vue Editor). Both approaches configurable to your needs.
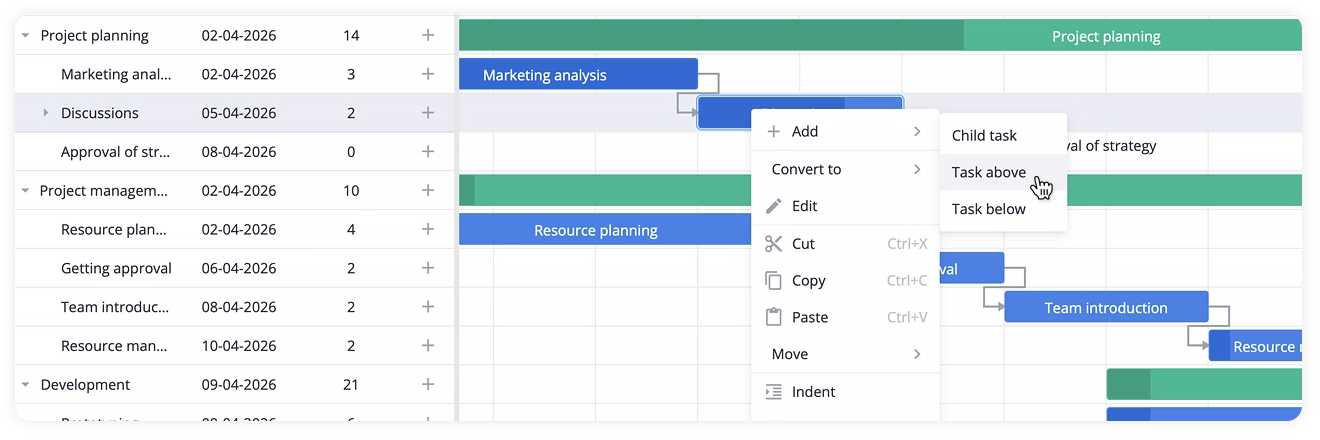
Toolbar, context menu, zooming
This Vue Gantt chart comes with built-in context menu and toolbar, giving end users a convinient way to access tasks operations: add, edit, delete, move, and more. Users can also zoom the timeline in and out to switch between a project overview and a detailed daily schedule.
Performance with large datasets
Virtual rendering and dynamic sub-task loading keep the component fast even when dealing with thousands of tasks. The UI stays responsive whether you’re navigating a complex project or editing on the fly.
See the demo with 10,000 tasks →
Backend Integration
SVAR Vue Gantt connects to any backend. The RestDataProvider helper handles loading, saving, and syncing task data — including batch operations — so backend integration doesn’t require custom wiring for every CRUD operation. A Go backend example is available to help you get started quickly.
A Quick Look at the API
Getting a Vue Gantt chart on screen takes a few lines:
<script>  import { Gantt, Willow } from "@svar-ui/vue-gantt";
  const tasks = [    { id: 1, text: "Project planning",  type: "summary", open: true },    { id: 2, text: "Marketing analysis", start: new Date(2026, 3, 2), duration: 3,  parent: 1 },    { id: 3, text: "Discussions", start: new Date(2026, 3, 5), duration: 2,  parent: 1 }  ];
  const links = [    { id: 1, source: 2, target: 3, type: "e2s" }  ];</script>
<template>   <Willow>      <Gantt :tasks="tasks" :links="links" />   </Willow></template>
From here, the component is customizable at every level — grid columns, task bar templates, time scales, edit form, CSS variables for theming.
Find the details in the docs →
SVAR Vue Gantt PRO: For Complex Scheduling
SVAR Vue Gantt PRO edition extends the core with advanced scheduling logic required for real-world, enterprise project management. Here’s what it adds:
🔹 Critical Path and Slack Visualization
Identify which tasks are driving your project deadline and which have scheduling flexibility. Critical path analysis highlights the chain of tasks that directly affect the finish date. Slack visualization shows you where there’s room to move — and where there isn’t.
🔹 Baselines
Compare planned timelines against actual progress. Baselines let you capture a project snapshot and display it alongside the live schedule, so you can quickly spot where things shifted and by how much.
🔹 Auto-Scheduling
When you change a task’s start date or duration, SVAR Vue Gantt PRO automatically shifts all dependent tasks to maintain a valid schedule. For now, only finish-to-start dependency is automated.
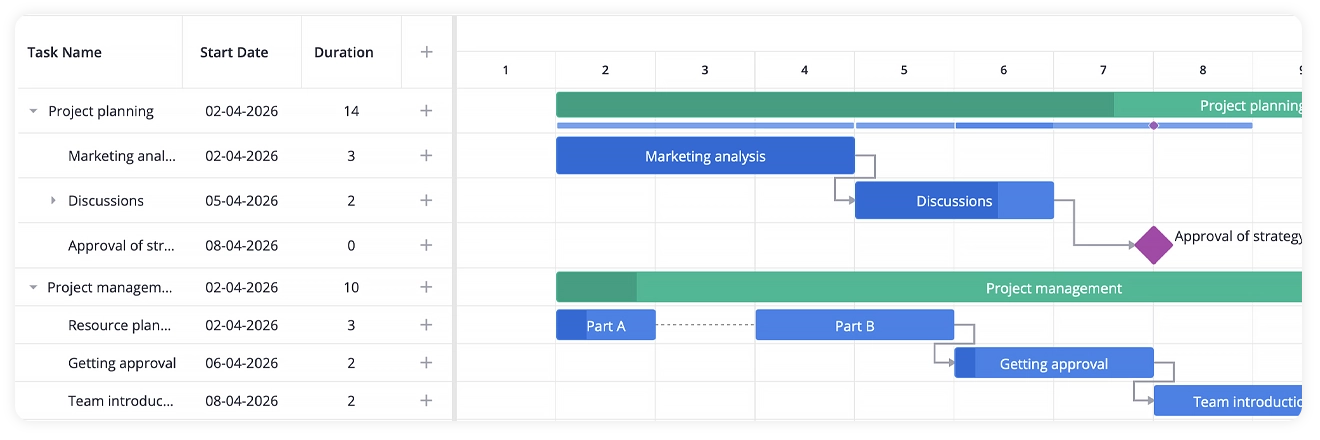
🔹 Split Tasks and Rollups
Represent interrupted or phased work by splitting a task into multiple segments on the timeline, keeping it in a single row. Rollup display brings sub-task bars up to the summary level for a high-level view of progress across the project.
🔹 Work Days Calendar
Define a global working calendar with custom schedules, exceptions, and non-working days. Task durations, dates, and dependency calculations all respect the calendar — so a “5-day task” actually takes 5 working days, not 5 calendar days.
🔹 Export to PDF, Excel, and MS Project
Server-side export service is available for PDF, PNG, and Excel formats. Also, client-side import and export of MS Project XML is supported, making it straightforward to hand off schedules to teams using MS Project or to migrate existing project data into your Vue app.
Get Started
The core component is free, open-source, and ready to use. And if you would like to try SVAR Vue Gantt PRO, the free 30-day trial is available:
If you run into questions during integration, the community forum is the right place. Our dev team is actively monitoring the forum and always happy to help.