

The Gantt chart, created by Henry Gantt in the early 20th century, was originally developed to simplify industrial production and optimize work scheduling. The chart gives you a visual representation of project workflow in a clear, understandable format.
Today, Gantt charts are a love-it-or-hate-it tool among project managers and team leads. Some praise them as an indispensable tool for managing massive projects with clarity. Others abandon Gantt charts as outdated, hard-to-maintain tools.
So what’s the real deal? Let’s see when Gantt charts can help you to track project progress and performance against deadlines, and when you can live without them. We will find out when and why to use Gantt charts nowadays, look at their key benefits, and see how to use them in web apps.
Why to Use Gantt Charts
First of all, let’s see why Gantt charts still remain the popular tool that enhances project visibility and improves coordination. Here are the key points:
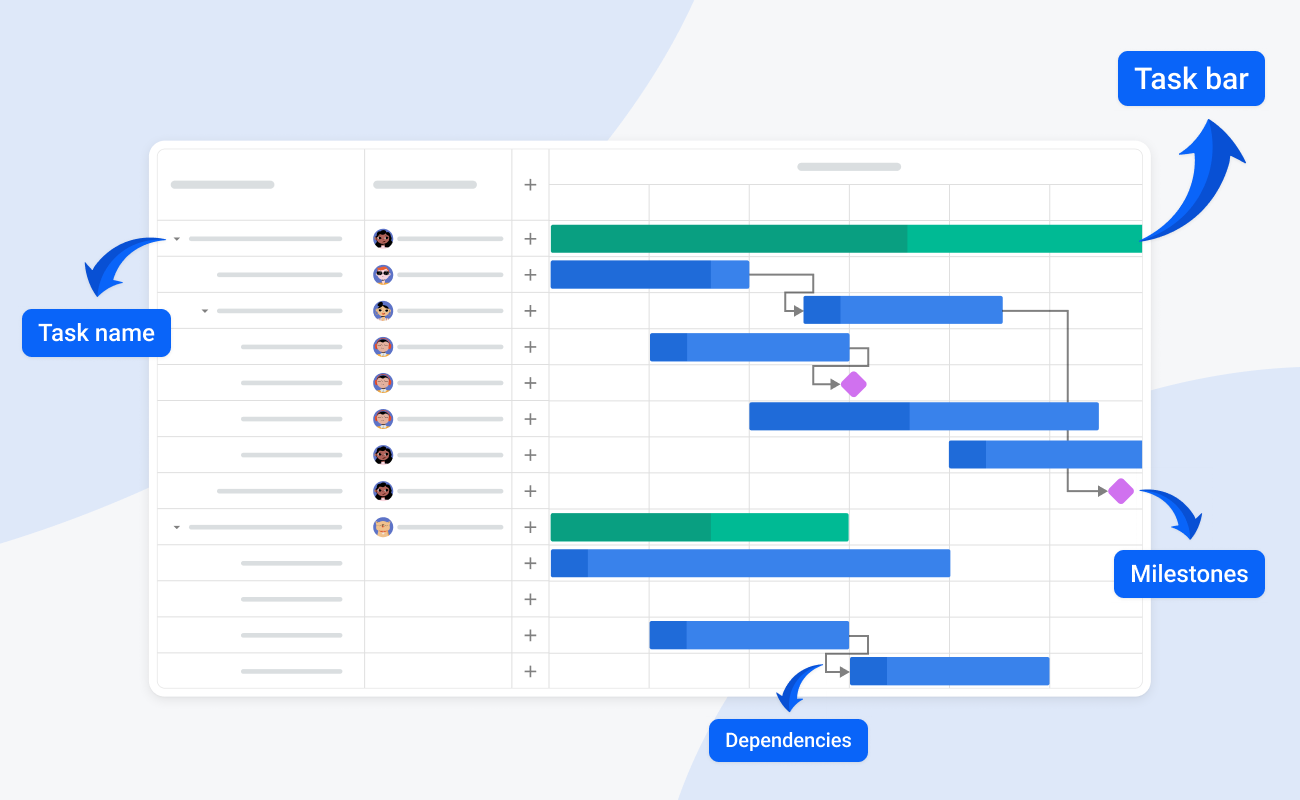
- Visualize your timeline: see how long a project should take and plan the order in which you will complete the tasks.
- Allocate resources: determine the resources needed and see who’s doing what and when, and avoid overloading your team.
- Identify dependencies: manage the dependencies between tasks to avoid project delays.
- Spot gaps and overlaps: the visual nature of a Gantt chart also makes it easier to see if you have gaps or overlap.
- Track progress: visual cues like completion percentages or a “you are here” line make tracking intuitive.
- Simple way to give a big picture: visualize the project progress and ensure transparency for clients and executives in a way that everyone can understand.
- Communicate at a glance: maintain clear communication across teams and stakeholders.
For project managers, a Gantt chart serves as a centralized hub for monitoring deadlines, adjusting schedules, and keeping everyone on the same page.
When Gantt Charts Work Best
If you are managing a long-term project with multiple tasks, interdependencies, and strict deadlines, a Gantt chart is the ideal tool to bring structure and clarity. Here are the key cases where Gantt charts work best:
- Long-term projects: when your project is year- or months-long;
- Complex projects with lots of tasks and dependencies, if one task is delayed, the entire timeline can be impacted;
- Multi-team projects (especially with international teams) which need to be sync on workflow;
- Projects with a critical path when delays in one task ripple through everything;
- Waterfall-friendly domains like construction, manufacturing, and other;
- Executive reporting is needed: a well-structured Gantt chart remains one of the clearest ways to present progress during quarterly reviews.
When NOT to Use Gantt Charts
There some cases when using Gantt charts can be unnecessary when the overhead outweighs the value, such as:
- Small/simple projects: these usually can be presented with a task list or kanban board, which often provide all the clarity you need;
- Agile or highly iterative projects: in fast-changing dev environments, Gantt charts can become outdated overnight so they become too complex and time-consuming to update;
- When flexibility trumps planning: if you pivot often, for example during initial project planning stages, a detailed Gantt might not be worth it.
- Maintenance overhead: When the effort to keep the chart updated exceeds its planning benefits.
Best Practises of Using Gantt Charts
Here are some tips on how to use Gantt charts efficiently and take your project under control:
Understand the chart
A Gantt chart is a high-level planning tool which shows structure, timing, and dependencies. Do not use it to replace your team’s day-to-day task boards or sprint backlogs.
Avoid over-detailing
Don’t try to map every single task. Overly granular Gantt charts quickly become cluttered and hard to maintain. Stick to key deliverables, milestones, and dependencies. Leave the fine details to your team’s internal tools.
Plan for change
Gantt charts aren’t naturally agile. For projects with a lot of uncertainty or “oh-no” moments, build in buffer time and expect to revise the plan. Consider updating your Gantt chart quarterly for steering committee reviews or major stakeholder presentations.
Use it as a coordination layer
For complex technical projects, it’s common to use Gantt charts only for milestones and summary tasks. Each development team can work with their preferred methods (Kanban, Jira boards), as long as they align on milestone dates.
Keep it readable
Gantt charts should be instantly understandable to both technical and non-technical stakeholders. Use clear labels, group tasks logically, and limit visual clutter.
Real-World Web Apps With Integrated Gantt Charts
Many well-known project management tools now use Gantt charts for workflow visualization and planning. Some of them include:
- Monday.com – uses Gantt charts to provide users with project tracking, team collaboration, and workload management tool
- Asana – offers Gantt-style timeline views to track dependencies and project progress.
- ClickUp – offers drag-and-drop Gantt charts to streamline workflows, prioritize deadlines, and take into account resource restrictions.
- Wrike – provides interactive Gantt charts with critical path analysis and real-time timeline adjustments for enterprise-level project coordination.
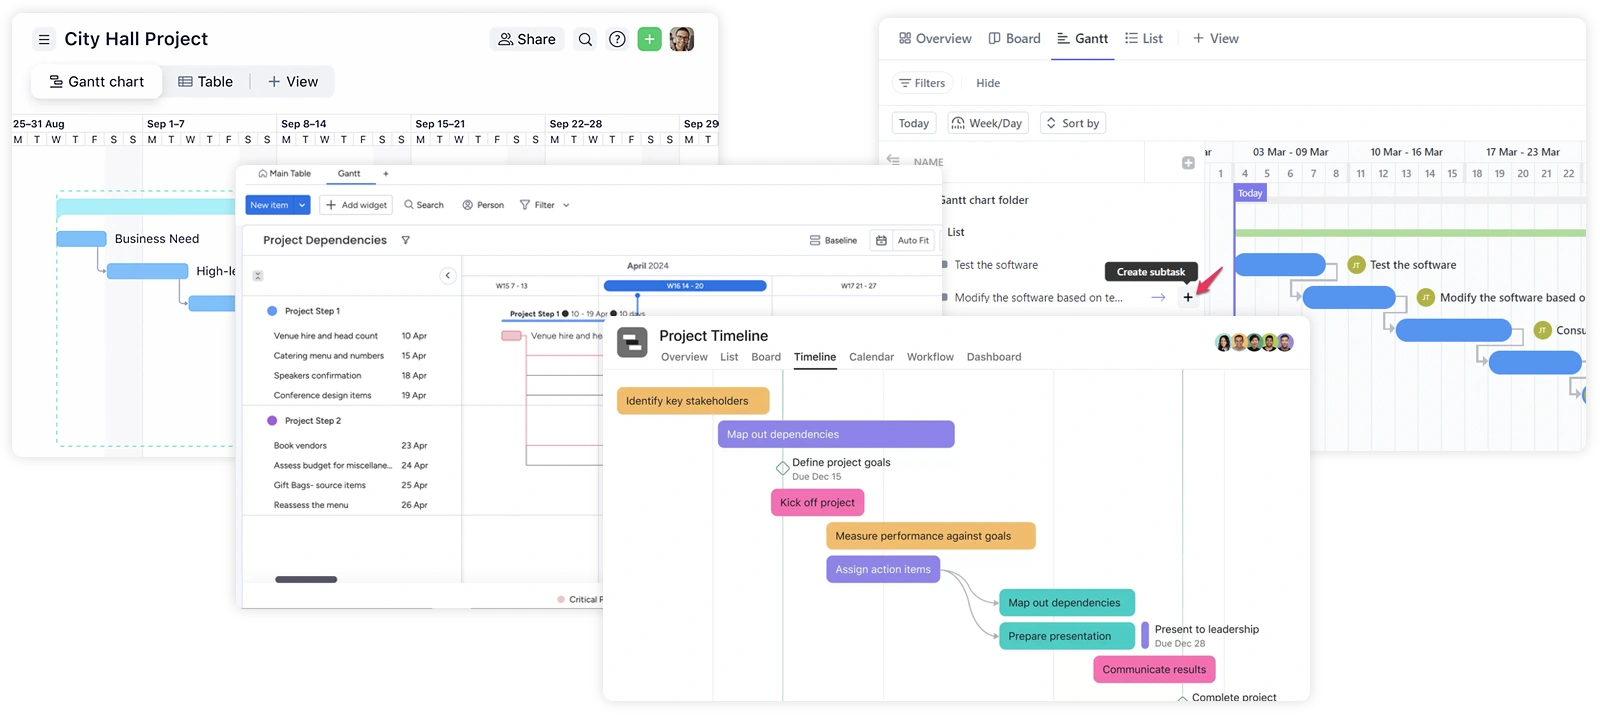
These tools highlight how Gantt charts remain popular for structured project planning and resource allocation.
SVAR Gantt: A Modern Web-Based Solution for React and Svelte
While many project management platforms offer Gantt chart functionality as part of their all-in-one solutions, some web applications might require a custom Gantt chart interface. Whether you’re building a custom project management tool or creating an internal dashboard, integrating a purpose-built Gantt component can be far more efficient than building one from scratch.
This is where SVAR Gantt enters the picture – a robust, fast and customizable UI component available for React or Svelte. It comes with built-in edit form, context menu, toolbar, drag-and-drop user interface, and clean design for both light and dark themes.
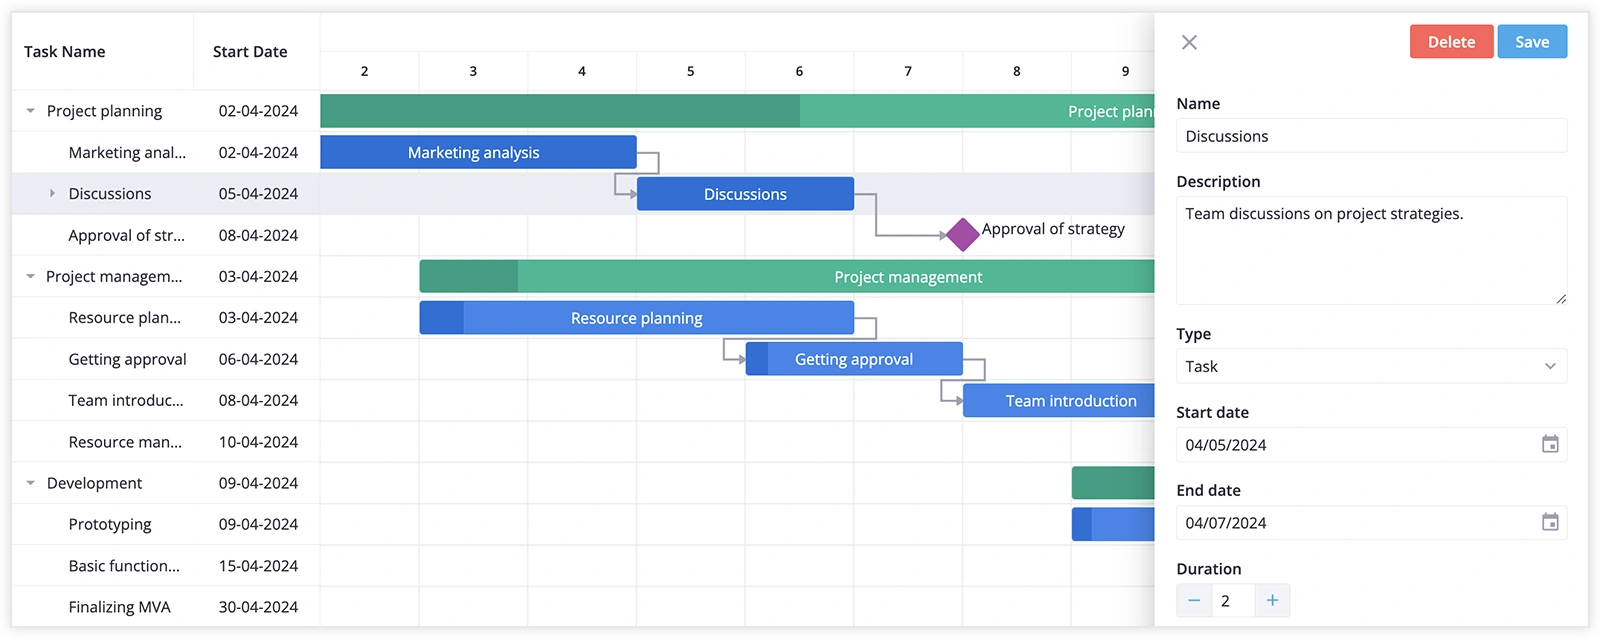
Key Features of SVAR Gantt:
- Customizable: adapt the UI to fit your workflow, including time scale, task bars, grid columns, and edit form.
- Task Dependencies: users can set the dependencies to visually display connections between tasks.
- Interactive UI: users can manage tasks via drag-and-drop in both timeline and task grid.
- Intuitive task editing: customizable task edit form, context menu, toolbar, tooltips for task bars.
- Backend Integration: RestDataProvider helper automates backend data syncing with optional batch mode for grouping multiple updates into a single HTTP request.
- Free, open-source: The core functionality of SVAR Gantt is available under the MIT license. If you need more complex features and built-in scheduling logic, you may try the PRO Edition that supports working calendars, auto-scheduling, critical path, baselines, export to MS Project, and more.
So if you’re considering adding a Gantt chart in your React or Svelte app as a project management tool, the ready-to-use SVAR Gantt component can save you lots of development hours.
Conclusion
Gantt charts have remained one of the most effective tools for managing and tracking projects, evolving from early industrial use to sophisticated digital solutions. They can help you organize your workflow and take into account all project details if you use them smartly.
If you choose this tool for your project planning activities and would like to integrate a Gantt chart in your own app, SVAR Gantt component can be a great option. Whether you’re managing product development, client work, or cross-functional initiatives, a well-integrated Gantt chart helps keep your team aligned and your deadlines on track.