In the times of intensive development and innovations, effective task management is a must. There is no doubt that the Gantt chart, invented in the early 20th century, still remains one of the solid options for project planning and visualization. So today we’re introducing SVAR Gantt for React, a ready-made, open-source UI component that makes it easy for developers to add a custom Gantt chart to their React-based apps.

With SVAR Gantt, you can implement a sleek, fast-performing Gantt diagram with minimal effort - saving significant development time compared to building it from scratch. With the comprehensive how-to-start guide, it takes just minutes to add the component to your React project and start managing your first project timeline.
Unlike traditional hand-drawn Gantt charts, our component offers an interactive interface where end-users can add and edit tasks and their dependencies directly on the timeline, making project progress tracking and task planning more efficient than ever.
So what powerful features does SVAR React Gantt chart bring to your project?
Core Task Management
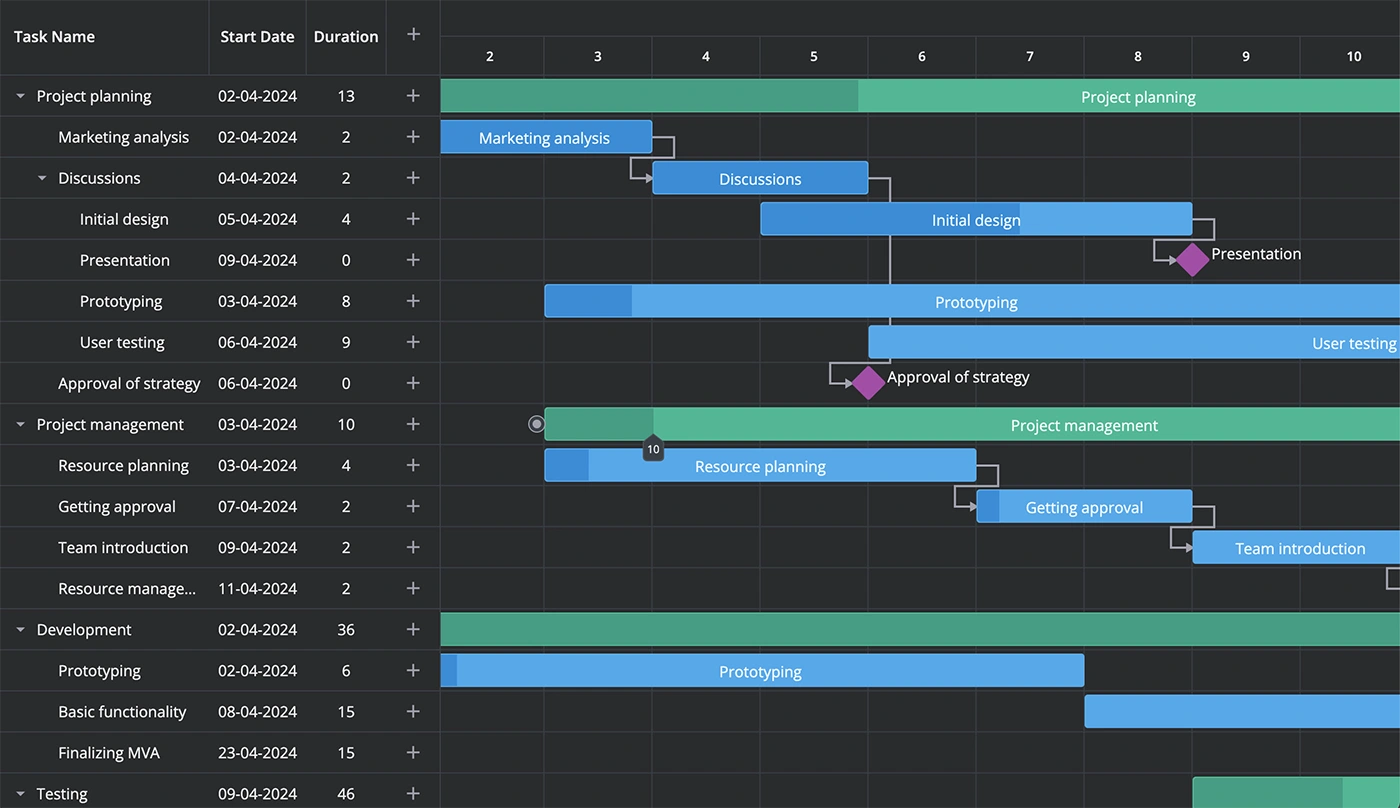
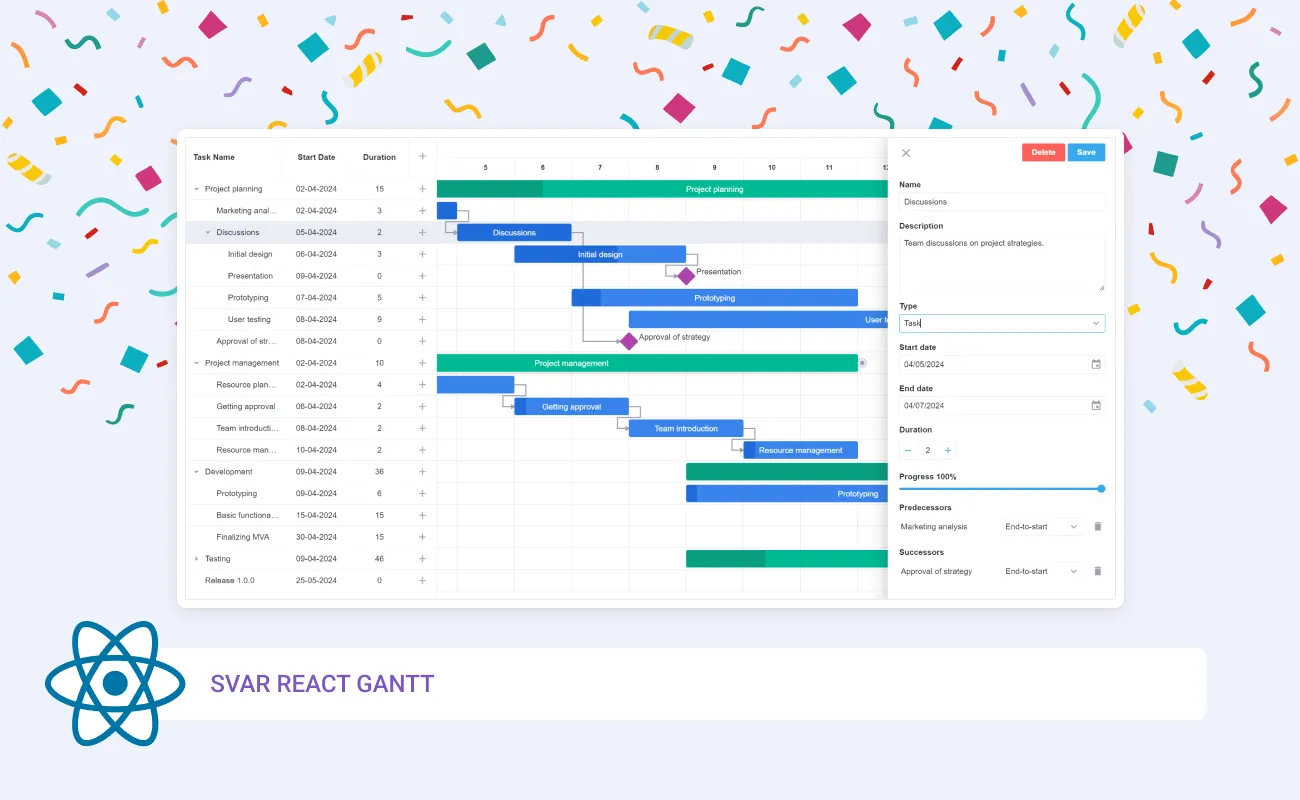
The component offers essential functionality for managing tasks within a project. Users can easily create, edit, and delete tasks either via a simple task edit form or directly on the chart using drag-and-drop. Moving or resizing task bars on the timeline automatically adjusts the start and end dates, as well as the task duration.
Each task bar visually displays progress in percentages, making it easier to track the status of individual tasks and overall project progress at a glance.

SVAR Gantt for React supports three types of tasks:
- task
- summary task
- milestone
The length of a summary task is automatically calculated on the fly based on the duration of its sub-tasks, whether they are modified on the timeline with drag-and-drop or in the task edit form. Additionally, the progress of a summary task can be auto-calculated to reflect the state of all included sub-tasks, streamlining project tracking and ensuring accuracy.

Task Dependencies
The Gantt chart supports visualization of task dependencies that can be defined and edited either with a task edit form or right on the timeline. This includes various types of dependencies:
- End-to-start
- Start-to-start
- End-to-end
- Start-to-end
Understanding these dependencies is crucial, as they help ensure tasks are completed in the correct order, minimizing delays and optimizing project workflow.
Interactive UI
As we already mentioned, SVAR React Gantt gives users full control over projects and tasks via edit form or intuitive drag-and-drop interface. Users can easily edit tasks and dependencies directly on the timeline, define progress on task bars, and reorder tasks in the grid on the left.
With a built-in context menu and toolbar options, you can give users a convenient way to access frequently used actions for task management. Both menu and toolbar are customizable so you can tune them up to your project needs.

Live Zooming
The zooming feature allows users to focus on specific tasks or phases of a project, providing a clearer view of timelines, dependencies, and progress. By zooming out, users can get a broader perspective of the entire project timeline, helping identify milestones, critical paths, and overall progress at a glance.
Rich Customization
The appearance of the Gantt chart is fully customizable using CSS variables, allowing you to easily style task bars with custom forms, colors, and fonts to match your specific needs and preferences. The chart also comes with two modern and vibrant skins — light and dark — so you can choose the theme that best fits your project’s visual design.

The timeline is fully configurable, including adjustable height, width, and borders parameters. You can also highlight weekends and holidays with specific colors to consider them when planning tasks.
In addition to displaying progress directly on task bars, you can define custom tooltips with detailed information for quick insights. Define what information to include in these tooltips to provide more context for each task.
Performance & Data Handling
In addition to all the above, SVAR Gantt chart handles large datasets efficiently through optimized rendering and dynamic loading of sub-tasks. End users can add numerous tasks and still enjoy fast performance and responsiveness.
See how fast SVAR React Gantt can render a Gantt chart with 10,000 tasks.
This is a client-side component and it can be integrated with any backend. To simplify the data binding process, we offer RestDataProvider - a special helper that listens to the user actions and sends REST requests to perform the corresponding data updates on the backend. For better performance, RestDataProvider supports batch updates, combining multiple API calls into one HTTP request.
Get Started with SVAR Gantt Today
SVAR Gantt for React combines essential task management features with simplicity — from intuitive task handling and dependencies to seamless data management and rich customization options. It offers everything you need to add professional project timeline visualization to your React application.
Here’s how to get started with SVAR Gantt:
- Check out our live demos to see SVAR Gantt in action
- Visit the detailed installation guides and API references
To add SVAR Gantt to your project, download and install it via npm:
npm install wx-react-ganttThen, include the component in your React file:
<script>  import { Gantt } from "wx-react-gantt";
  const tasks = [    {      id: 1,      start: new Date(2024, 3, 2),      end: new Date(2024, 3, 17),      text: "Project planning",      progress: 30,      parent: 0,      type: "summary",      open: true,      details: "Outline the project's scope and resources.",    },  ];  const links = [];  const scales = [    { unit: "month", step: 1, format: "MMMM yyy" },    { unit: "day", step: 1, format: "d", css: dayStyle },  ];</script>
<Gantt {tasks} {links} {scales} />
For more detailed instructions, visit the documentation.
Have questions or suggestions?
Join our community forum to report issues, get help or submit feature requests. Follow us on Twitter or subscribe to our newsletter to stay updated with the latest news of SVAR React.
Start building better project management tools with SVAR Gantt for React, your open-source solution for timeline visualization!


