

Introduction
This tutorial continues from Part 1: Building a Gantt Chart in Next.js with SVAR React Gantt, where we integrated an interactive Gantt diagram with styling, proper SSR hydration handling, and a task edit panel.
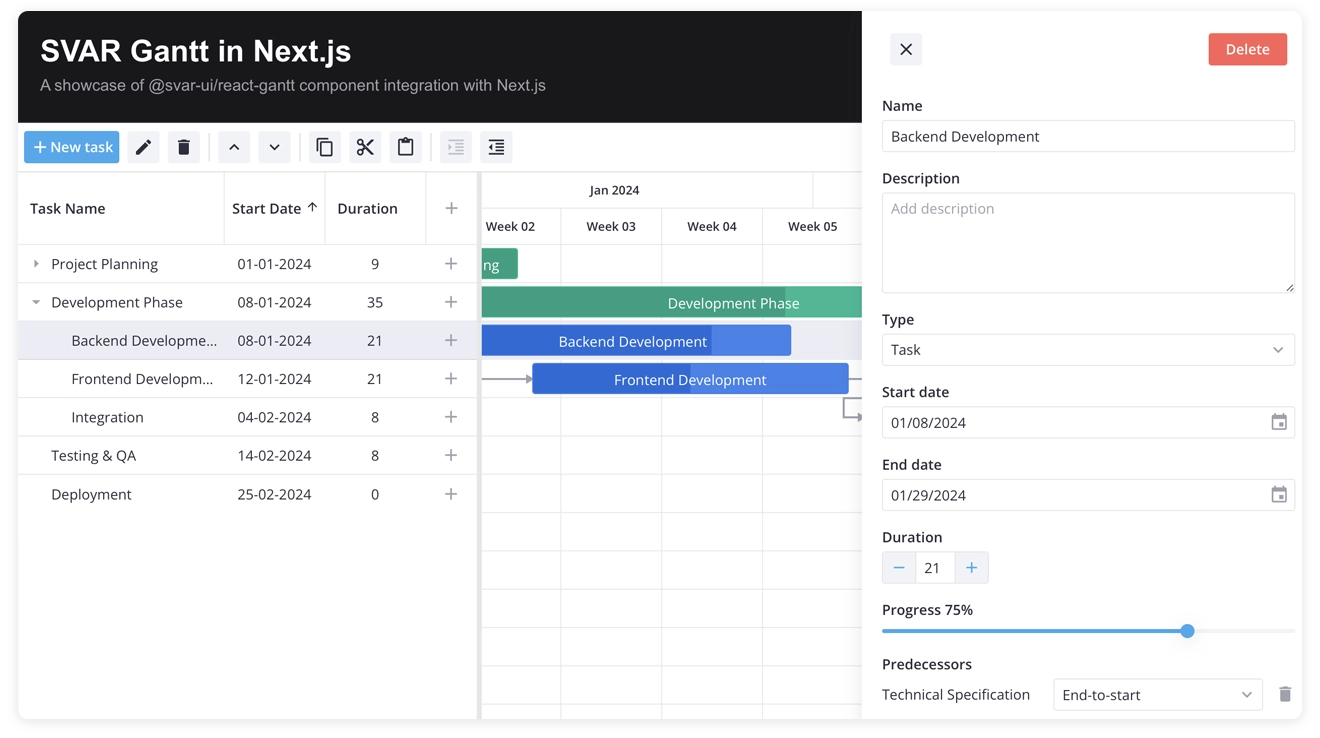
Using SVAR React Gantt, we’ve created a working Gantt chart where users can edit tasks and dependencies on the timeline or via the task edit form. But if you refresh the page, all those changes will disappear. Real project management apps need persistence, so in this second part we’re adding a backend to save changes to a database.
This backend layer will also enable team collaboration on shared project data and provide server-side validation to keep everything consistent. Let’s extend our demo with persistent storage and structured API handling.
What we’ll build
Time estimate: 20 minutes
Difficulty: Beginner to intermediate (basic knowledge of Next.js and React)
Part 2 of 2: Start with Part 1: Setup
Demo code: Full source on GitHub
In this part of the tutorial, we’ll cover:
- Next.js API routes for CRUD operations
- Set up SQLite database for persistent storage
- Automatic sync between UI and server
- Drag-and-drop task reordering with backend support
- Toolbar for quick actions
- Error handling for failed operations
Why Add a Backend?
Next.js makes it incredibly easy to add backend functionality. API routes live right alongside your components, you get type safety across the full stack with TypeScript, and deployment is straightforward whether you’re using Vercel, a VPS, or Docker.
With a backend, users can edit tasks, reorder them, and have those changes persist across sessions, which is essential for real project management tools.
For this tutorial, we’ll use SQLite as our database. It’s file-based, requires no separate server, and is perfect for demos and small teams. When you need to scale, the SQL schema migrates easily to PostgreSQL or MySQL.
SQLite keeps things simple so we can focus on the integration patterns—not database administration.
Setting Up the Database
First, let’s add the SQLite package:
npm install better-sqlite3npm install -D @types/better-sqlite3The database module lives at src/lib/db.ts. The schema has two tables: one to store tasks data and another one - for dependencies:
CREATE TABLE tasks (  id INTEGER PRIMARY KEY AUTOINCREMENT,  text TEXT DEFAULT '',  start TEXT,  end TEXT,  duration INTEGER,  progress INTEGER DEFAULT 0,  type TEXT,  parent INTEGER DEFAULT 0,  orderId INTEGER DEFAULT 0);
CREATE TABLE links (  id INTEGER PRIMARY KEY AUTOINCREMENT,  source INTEGER NOT NULL,  target INTEGER NOT NULL,  type TEXT NOT NULL);
A few notes on the schema:
-
startandendare stored as TEXT (ISO date strings like"2024-01-15"). SQLite doesn’t have a native date type, but ISO strings sort correctly and are easy to parse in JavaScript. -
parentcreates the hierarchical task structure. A value of0means top-level task; any other number references another task’s ID. This is how we represent “Requirements Gathering” as a subtask under “Project Planning.” -
orderIdmaintains display order. When you drag a task to reorder it in the grid, we update this value. Siblings (tasks with the same parent) are sorted byorderIdwhen fetching from the database. -
typeon tasks can be"summary"(parent task with children),"milestone"(zero-duration marker), ornullfor regular tasks. This affects visual styling in the Gantt chart. -
typeon links defines the dependency relationship:"e2s"= end-to-start (Task A must finish before Task B starts)"s2s"= start-to-start (both tasks start together)"e2e"= end-to-end (both tasks end together)"s2e"= start-to-end (Task B can’t end until Task A starts)
The database initializes automatically on first access. If the tables are empty, it seeds them with sample project data so you have something to display immediately.
Loading Data
With the database schema in place, let’s connect it to our Gantt chart. We’ll build REST API routes on the server side and use a data provider on the client to handle fetching and parsing.
Server Side
The server needs to expose tasks and links through REST endpoints. Here’s what the tasks route looks like at src/app/api/tasks/route.ts:
import { NextResponse } from "next/server";import { getAllTasks, createTask } from "@/lib/db";
export async function GET() {  const tasks = getAllTasks();  return NextResponse.json(tasks);}
The links route follows the same pattern. One thing worth noting: dates are stored as ISO strings in the database. We’ll handle conversion on the client.
Client Side
To connect the Gantt to our backend, we’ll use the special RestDataProvider service that comes with SVAR Gantt:
npm install @svar-ui/gantt-data-providerThe component changes are minimal. Instead of hardcoded arrays, we initialize a RestDataProvider and call its getData() method:
const server = useMemo(() => new RestDataProvider("/api"), []);
useEffect(() => {  server.getData().then((data) => {    setTasks(data.tasks);    setLinks(data.links);  });}, [server]);
What’s RestDataProvider helper actually doing? It’s a thin wrapper around fetch that ensures two things:
- Fetches
/api/tasksand/api/linksin parallel - Converts date strings from JSON into JavaScript
Dateobjects
That’s it for loading. RestDataProvider understands REST conventions and handles data parsing automatically, so your Gantt component receives properly formatted data without extra transformation logic.
Saving Data
To persist changes, we need a full set of REST endpoints:
| Method | Endpoint | Purpose |
|---|---|---|
| GET | /tasks |
Get all tasks |
| POST | /tasks |
Create task |
| PUT | /tasks/{id} |
Update task |
| DELETE | /tasks/{id} |
Delete task |
| GET | /links |
Get all links |
| POST | /links |
Create link |
| PUT | /links/{id} |
Update link |
| DELETE | /links/{id} |
Delete link |
For POST and PUT, the response should include the ID: { "id": 123 }. For DELETE, return an empty object: {}. You can check the REST routes documentation for detailed request/response formats.
Connecting the Component
With endpoints ready, we connect the data provider to the Gantt through its init callback:
const init = useCallback((api) => { api.setNext(server);}, [server]);Calling api.setNext(server) connects your data provider to the Gantt’s internal action system. Once configured, any user interaction that modifies data, such as creating tasks, updating dates, deleting dependencies, or reordering rows, automatically triggers the corresponding REST API call.
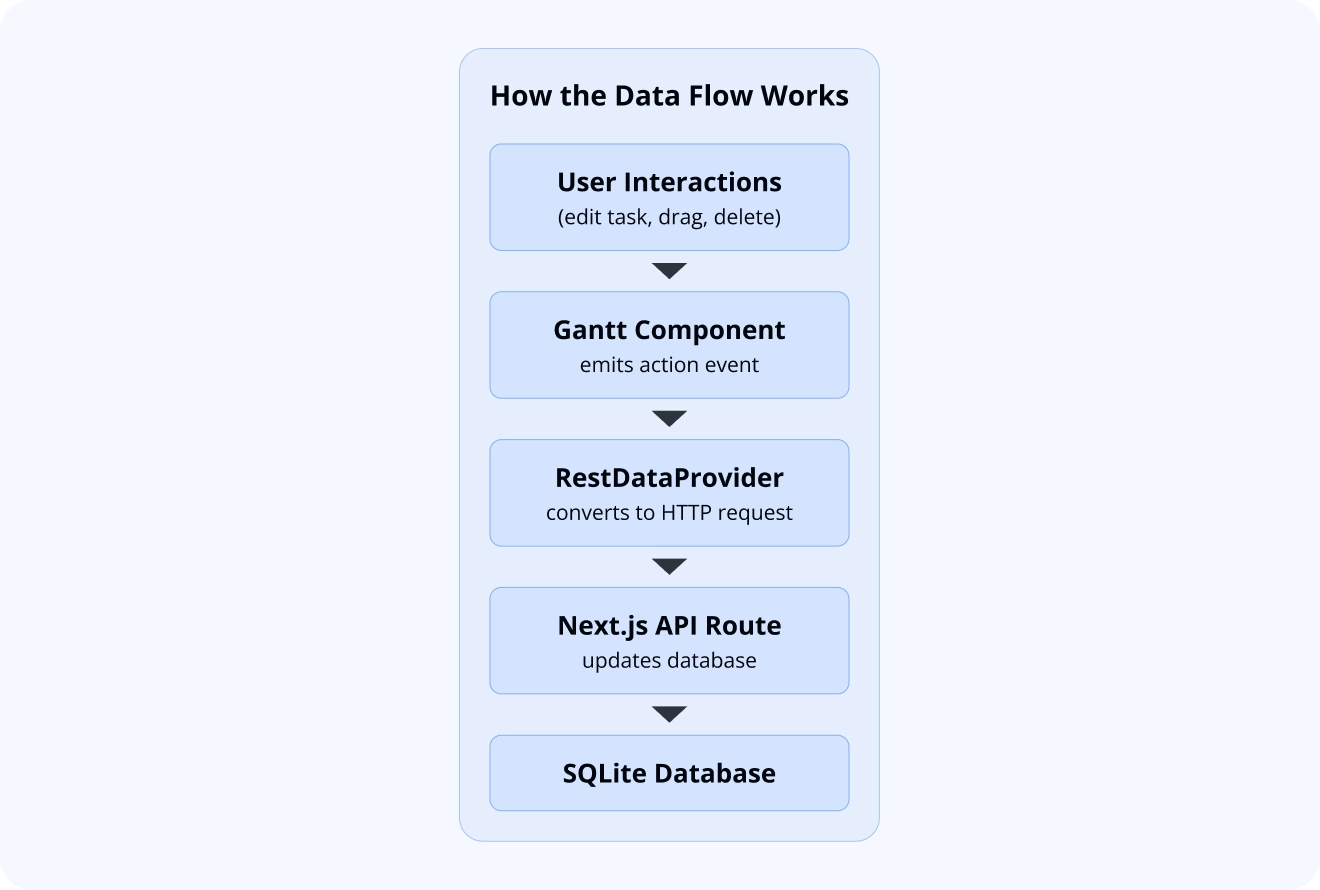
Here’s how it works:
- the Gantt component emits action events for every operation (
add-task,update-task,delete-task, etc.). - the
RestDataProviderlistens for these events, translates them into the appropriate HTTP requests (POST, PUT, DELETE), validates the payload, and sends it to your Next.js API routes. - when the server responds, the provider updates the UI automatically, including replacing temporary IDs with database-generated ones after creating new tasks.
This eliminates the need to manually wire event listeners, write fetch calls for each operation, or handle optimistic UI updates. The data provider abstracts the sync layer completely.
Row Reordering
SVAR React Gantt supports row reordering in the tasks grid in the left panel. Users can reorder tasks to their preferences, and the timeline is changed accordingly.
The client side already handles this behavior — the RestDataProvider sends move operations automatically. However the server needs special handling to track display order.
When a task is moved, the request includes extra fields:
{ "operation": "move", "mode": "after", "target": 4}This means “place this task after task #4”. The mode can be “after”, “before”, or “child” (to nest under another task).
To handle this on the server, we added logic in the PUT endpoint that checks for the operation field. When it’s a move operation, instead of updating task properties, we recalculate the task’s parent and orderId based on where it’s being placed. Siblings get their orderId values shifted to make room.
Similarly, POST requests for new tasks can include mode and target to specify where in the hierarchy the task should appear.
Adding the Toolbar
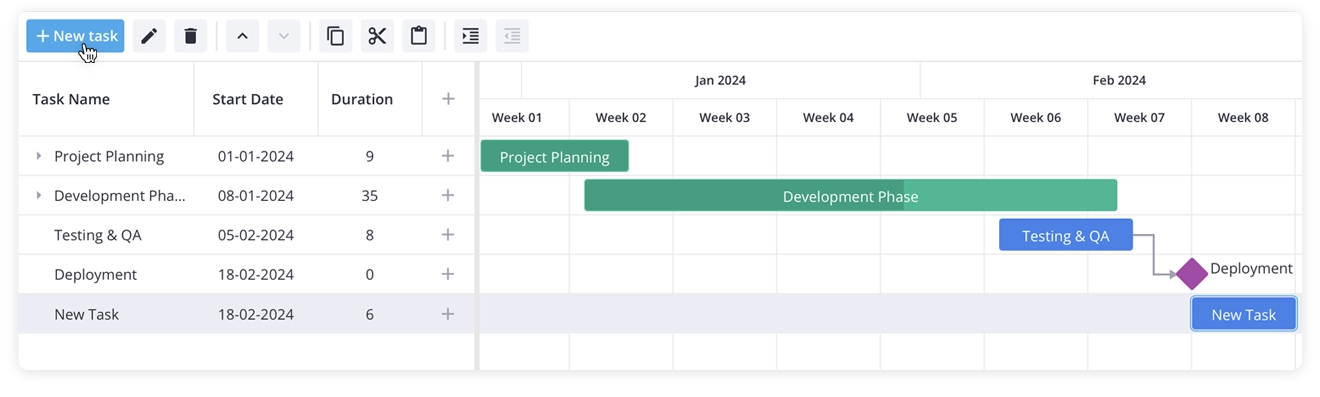
To better test the reordering feature, and to give users quick access to other operations like adding tasks, deleting and indenting, we’ll add the Toolbar component above the Gantt chart.
The toolbar is included in the Gantt package, so no extra install needed. The component needs the Gantt’s API reference to trigger actions, so we capture it during initialization and pass it to both the Toolbar and Editor (used for task edit panel):
<Willow> <div style={{ display: "flex", flexDirection: "column", height: "100%" }}> <div style={{ borderBottom: "1px solid #e0e0e0" }}> <Toolbar api={api} /> </div> <Gantt tasks={tasks} links={links} scales={scales} init={init} /> <div style={{ flex: 1 }}> {api && <Editor api={api} />} </div> </div></Willow>We wrapped everything in a flex container to ensure proper layout: the toolbar stays at the top with a border separator, the Gantt fills available space, and the Editor panel appears when a task is selected.
Clicking “Add Task” in the toolbar creates a task through the same action pipeline, which flows through the data provider to the REST endpoint. This way everything stays in sync.
Handling Errors
Sometimes network requests fail, databases go down, or users lose internet connections mid-save. When building production applications, you need to handle these failures gracefully rather than leaving users staring at a broken interface wondering what happened.
The good news is that our Gantt setup provides several layers where you can catch errors and decide how to respond. Let’s walk through each one and discuss practical strategies for keeping your application resilient.
When Initial Data Loading Fails
The getData() method returns a promise, which means handling fetch failures follows the standard pattern you’re already familiar with. If the server is unreachable or returns an error status, you can catch that in your component and show an appropriate message to the user:
server.getData() .then((data) => { setTasks(data.tasks); setLinks(data.links); }) .catch((error) => { // Show error UI, retry option, etc. console.error("Failed to load data:", error); });In a real application, this catch block is where you’d display an error message or a retry button. The important thing is giving users visibility into what went wrong and a path forward, rather than just showing an empty Gantt chart with no explanation.
Handling Failed Save Operations
Save operations work differently because they happen as side effects of user interactions. When someone edits a task and the server rejects the change, the error information flows back through the component’s event system. You can listen for specific action failures and respond accordingly, like reverting a change or highlighting the problematic row.
That said, there’s an important principle here: your server shouldn’t be the primary validation layer. If users can perform invalid operations in the UI that only fail when they hit the server, you’re creating a frustrating experience.
Client-side validation should catch most issues before they become server errors. Things like date constraints, required fields, and permission checks belong in the UI where you can provide immediate feedback.
Server errors should be exceptional cases, like network failures or unexpected database problems. For most applications, the pragmatic approach when these rare errors occur is simple: tell the user something went wrong, and if they agree, reload the Gantt with fresh data from the server. This might feel crude, but it guarantees your UI stays synchronized with the actual database state rather than showing stale or inconsistent data.
Custom Error Handling with RestDataProvider
If you want to handle all REST operation failures in one place rather than sprinkling error handling throughout your component, you can create a custom data provider by extending RestDataProvider and overriding its send method:
class MyDataProvider extends RestDataProvider { async send<T>( url: string, method: string, data?: any, customHeaders: any = {} ): Promise<T> { try { return await super.send(url, method, data, customHeaders); } catch (error) { // Show toast notification, log to monitoring service, etc. showErrorNotification("Failed to save changes"); throw error; } }}This intercepts every REST call in one spot, giving you a single place to show notifications, log errors to your monitoring service, or implement retry logic. It’s the simplest way to ensure no failure goes unnoticed while keeping your error handling code organized and maintainable.
Progress and Sync State
Closely related to error handling is showing users when operations are in progress. For the initial data load, a loading spinner is usually overkill because the data fetches quickly and the spinner just causes a distracting flicker. However, you might want to show a subtle indicator when changes are being saved to give users confidence their edits are persisting.
Loading Progress
If your application does need a loading indicator during initial fetch, you can wrap the getData() promise with state management:
const [loading, setLoading] = useState(true); // your custom state
useEffect(() => {  server.getData()    .then((data) => {      setTasks(data.tasks);      setLinks(data.links);    })    .finally(() => setLoading(false));}, [server]);
Tracking All Server Operations
To track save operations as well, you can extend RestDataProvider and override the send method. The onProgress callback is your own function that you pass when creating the provider, letting you hook into every server interaction:
class MyDataProvider extends RestDataProvider {  constructor(url: string, private onProgress: (active: boolean) => void) {    super(url);  }
  async send<T>(url: string, method: string, data?: any, headers: any = {}): Promise<T> {    this.onProgress(true);    try {      return await super.send(url, method, data, headers);    } finally {      this.onProgress(false);    }  }}
// Usage:const server = new MyDataProvider("/api", (active) => setSaving(active));
This approach fires on every REST call, covering both the initial load and all subsequent saves, giving you complete visibility into when the application is communicating with your server.
Complete Component Code
Here’s the full GanttChart.tsx with all pieces we’ve covered in this tutorial:
"use client";
import { useState, useEffect, useCallback, useMemo } from "react";import type { ITask, ILink, IApi } from "@svar-ui/react-gantt";import { Gantt, Toolbar, Willow, Editor } from "@svar-ui/react-gantt";import { RestDataProvider } from "@svar-ui/gantt-data-provider";import "@svar-ui/react-gantt/all.css";
const apiUrl = "/api";
const scales = [  { unit: "month", step: 1, format: "%M %Y" },  { unit: "week", step: 1, format: "Week %w" },];
export default function GanttChart() {  const [mounted, setMounted] = useState(false);  const [tasks, setTasks] = useState<ITask[]>([]);  const [links, setLinks] = useState<ILink[]>([]);  const [api, setApi] = useState<IApi | undefined>();
  const server = useMemo(() => new RestDataProvider(apiUrl), []);
  useEffect(() => {    setMounted(true);    server.getData().then((data) => {      setTasks(data.tasks);      setLinks(data.links);    });  }, [server]);
  const init = useCallback((ganttApi: IApi) => {    setApi(ganttApi);    ganttApi.setNext(server);  }, [server]);
  if (!mounted) {    return <div style={{ height: "100%", width: "100%" }} />;  }
  return (    <div style={{ height: "100%", width: "100%" }}>      <Willow>        <div style={{ display: "flex", flexDirection: "column", height: "100%" }}>          <div style={{ borderBottom: "1px solid #e0e0e0" }}>            <Toolbar api={api} />          </div>          <Gantt tasks={tasks} links={links} scales={scales} init={init} />          <div style={{ flex: 1 }}>            {api && <Editor api={api} />}          </div>        </div>      </Willow>    </div>  );}
Summing Up
Over the course of this two-part tutorial series, we’ve built a production-ready Gantt chart application with Next.js and SVAR React Gantt.
In Part 1, we set up the Gantt component with proper styling, handled SSR hydration, and added interactive task editing. In this second part, we added the backend layer that makes it persistent and centrally stored.
Our complete application now includes Next.js API routes for full CRUD operations, SQLite database storage for tasks and dependencies, synchronization between the UI and server through RestDataProvider, and basic error handling strategies for real-world applications.
The Gantt component handles all the complexity of mapping user interactions to API calls. Your role is simply implementing the REST endpoints with whatever database and business logic your specific application requires.
If you want to explore further, here are some useful links:
- Complete demo code on GitHub
- SVAR React Gantt repository - we’d appreciate a ⭐ if you like the component
- Community forum (for any further questions on using SVAR React Gantt)
- Documentation
Happy coding!