
High Performance Vue Gantt Chart
Streamline project management with top-notch interactive SVAR Vue Gantt chart.
Plan, schedule, and track tasks with ease!
Also available for:


Streamline project management with top-notch interactive SVAR Vue Gantt chart.
Plan, schedule, and track tasks with ease!
You can use this Gantt chart across a wide range of screen sizes and devices. Whether you're accessing it from a desktop or smartphone, SVAR Gantt adjusts its layout and behavior to ensure optimal functionality.

For the best experience, view this page on a desktop device to enjoy the live demo, as it looks great on larger screens!
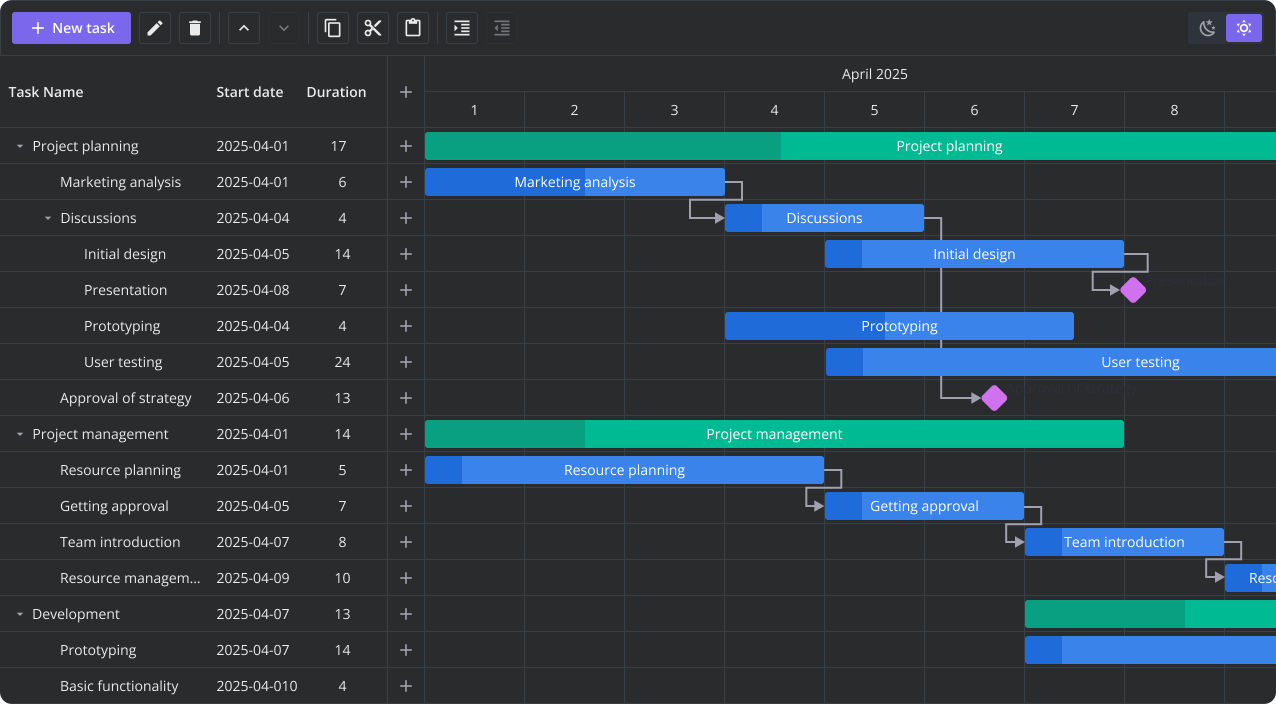
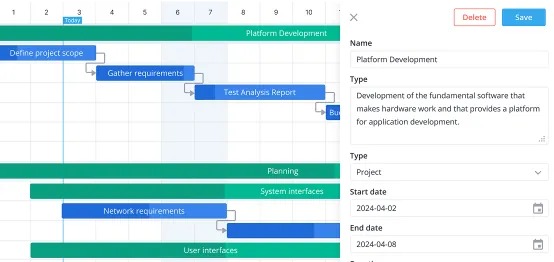
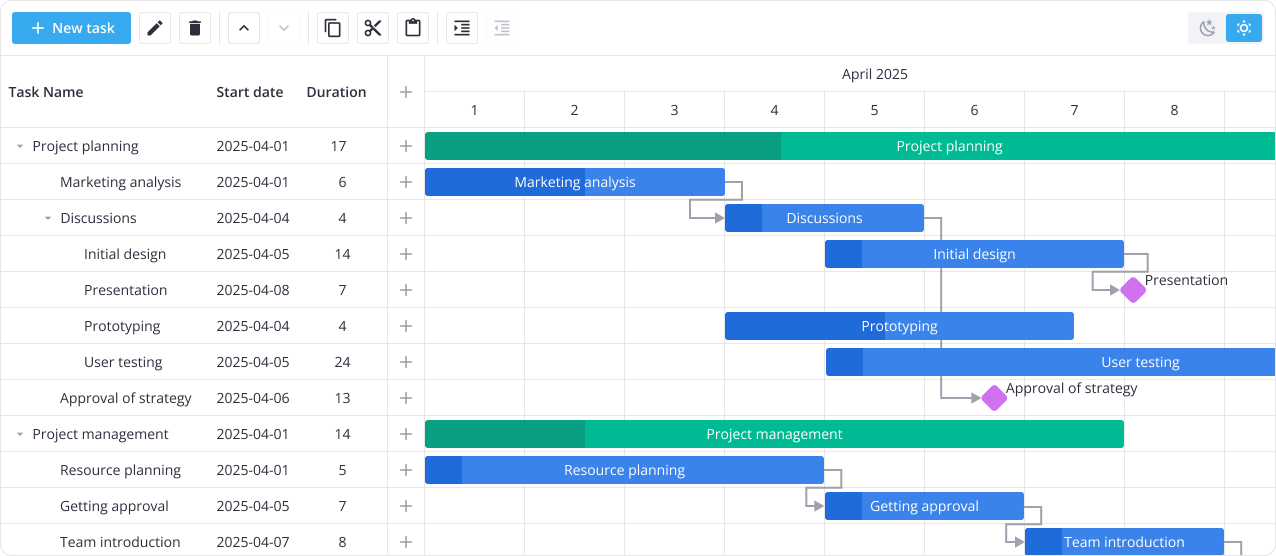
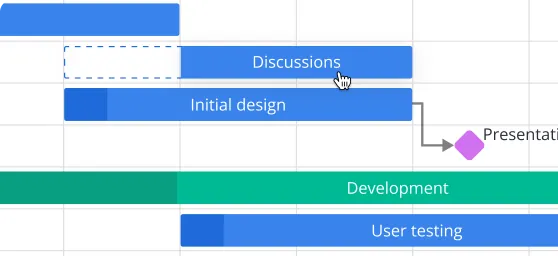
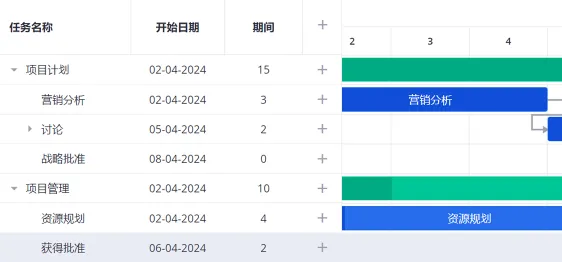
Tasks and their dependencies can be changed right on the timeline with a simple drag-and-drop feature. An intuitive edit form, activated by double-clicking on the task, allows users to easily change task details: name, description, deadline, dependencies, resources.
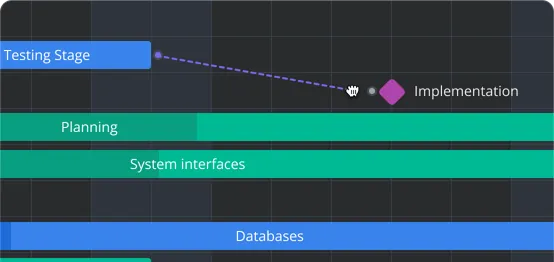
With SVAR Gantt's interactive interface, you can conveniently define task connections directly on the timeline or in the task edit form, specifying the task's predecessors and successors. In addition, SVAR Gantt supports the creation of sub tasks, enabling you to organize tasks in a hierarchical structure.
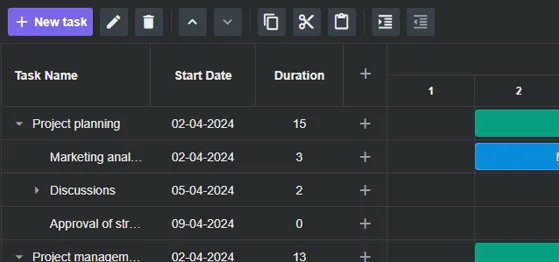
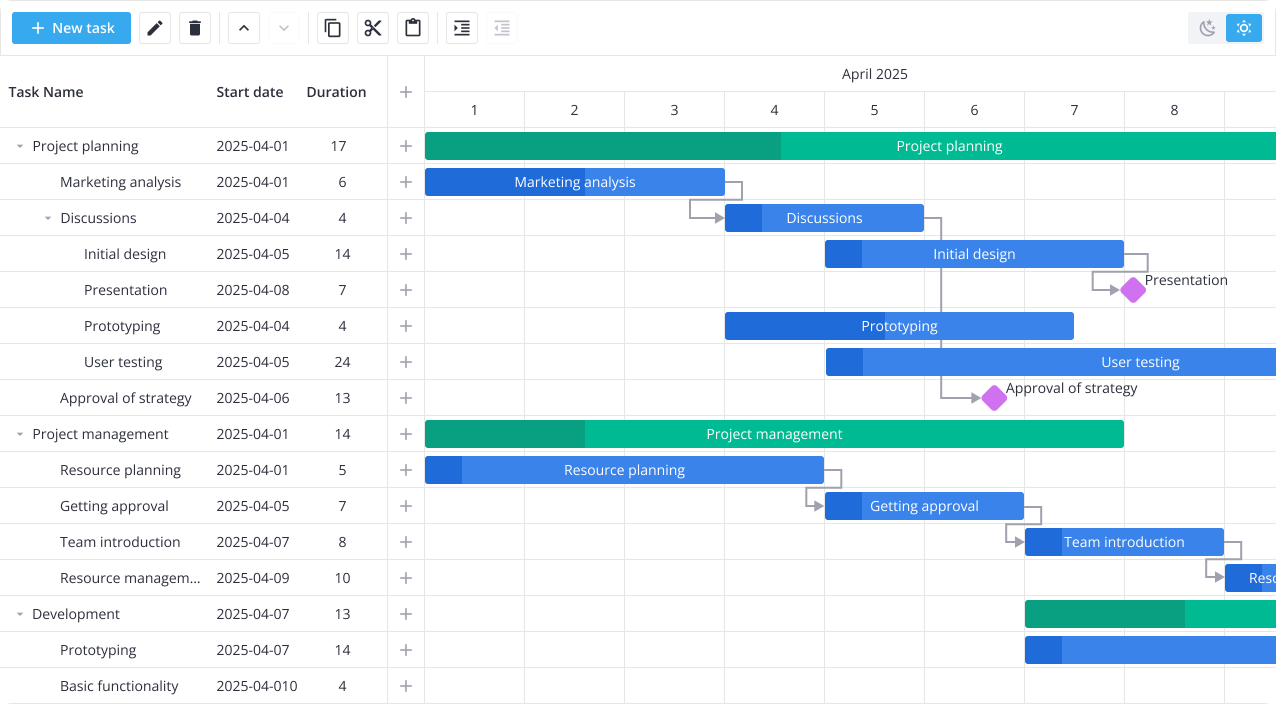
Effortlessly manage tasks with the intuitive toolbar. Add, delete, rearrange, and edit tasks with ease using toolbar buttons for moving tasks up/down, indent/outdent, copy/cut/paste features, or add your custom operations. You can also enable a context menu to stay in control of your project's timeline and structure.
The localization feature allows you to present the interface of the Gantt chart in the language you'd like. You can provide custom translations for actions (edit, delete), button labels, confirmation messages, task edit form fields and context menu items.
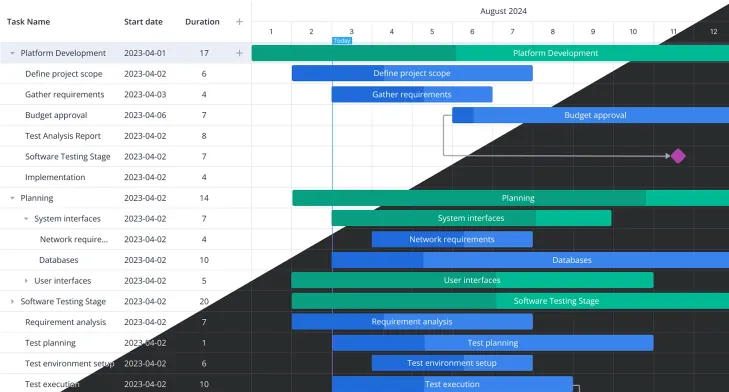
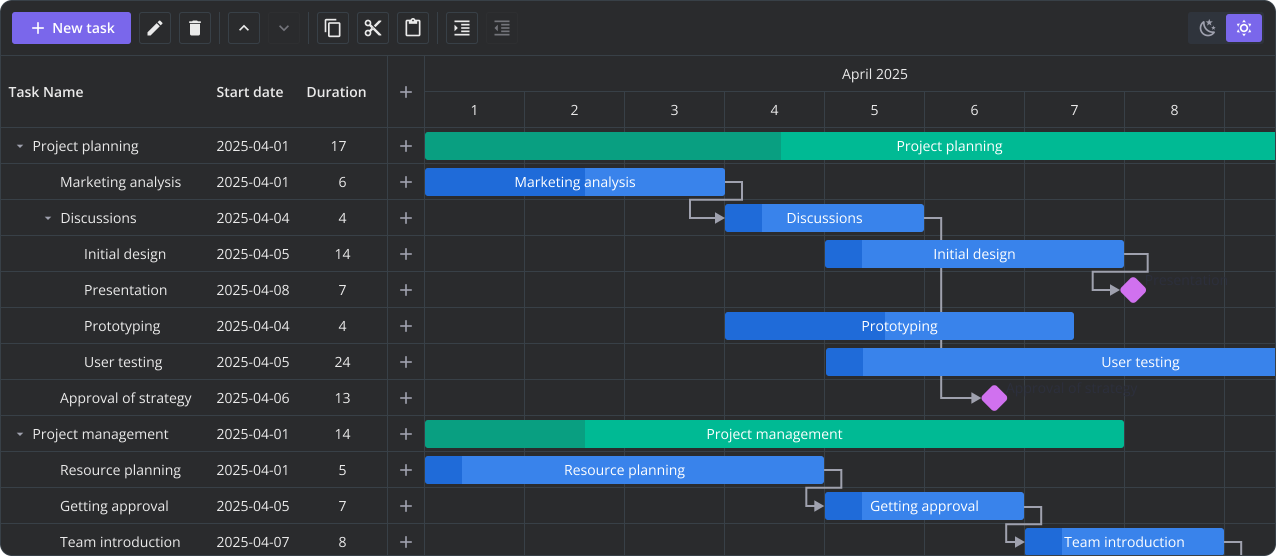
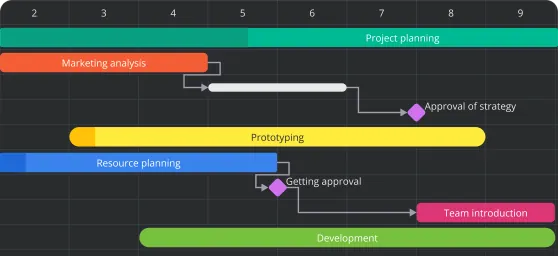
There are light and dark skins available. You can assign different colors to task bars based on their types or priorities. This allows for easy visual identification, such as highlighting urgent tasks in red or using specific colors to represent different task categories.