Feature-rich Svelte Pivot Table
Add a well-designed pivot table interface that makes it easy to organize, summarize, and compare complex data. Effortlessly extract meaningful insights from large datasets.
Also available for:


Add a well-designed pivot table interface that makes it easy to organize, summarize, and compare complex data. Effortlessly extract meaningful insights from large datasets.
We are happy to offer fast-performing and interactive Svelte UI widgets. We plan to release SVAR Pivot component in the near future so you will be able to add an effective work management tool to
your Svelte web app.
For the best experience, view this page on a desktop device to enjoy the live demo, as it looks great on larger screens!
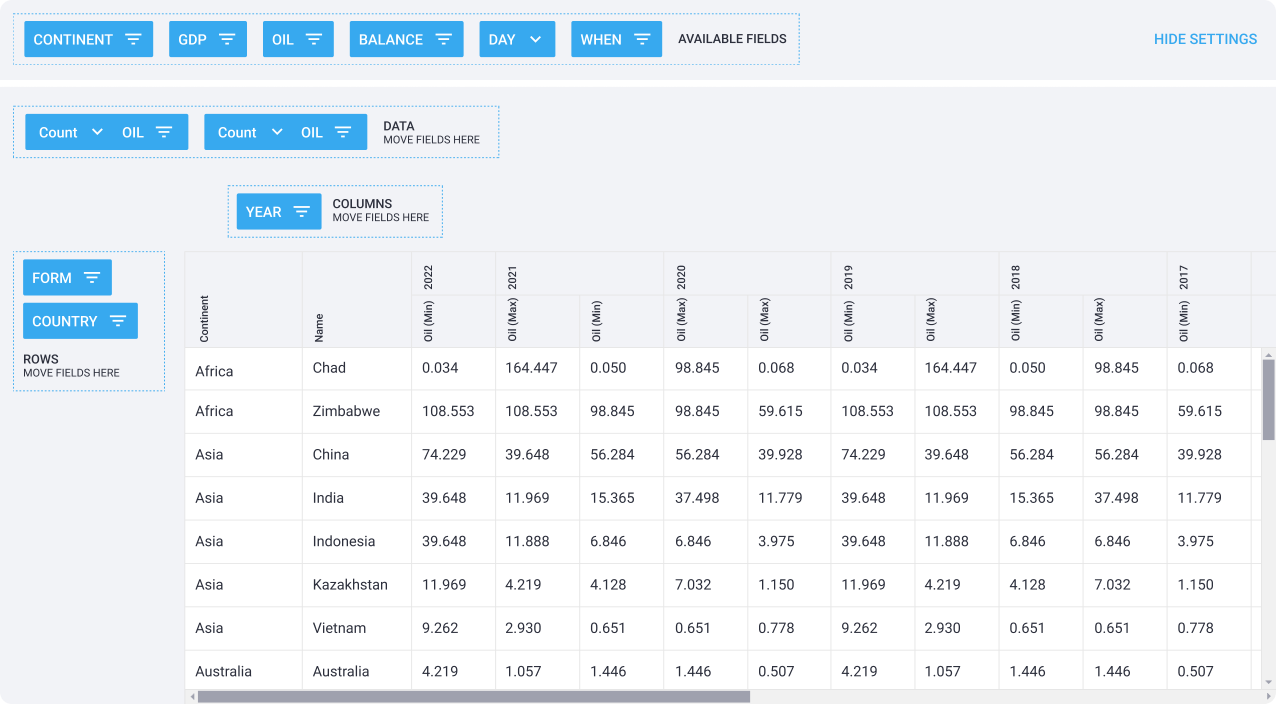
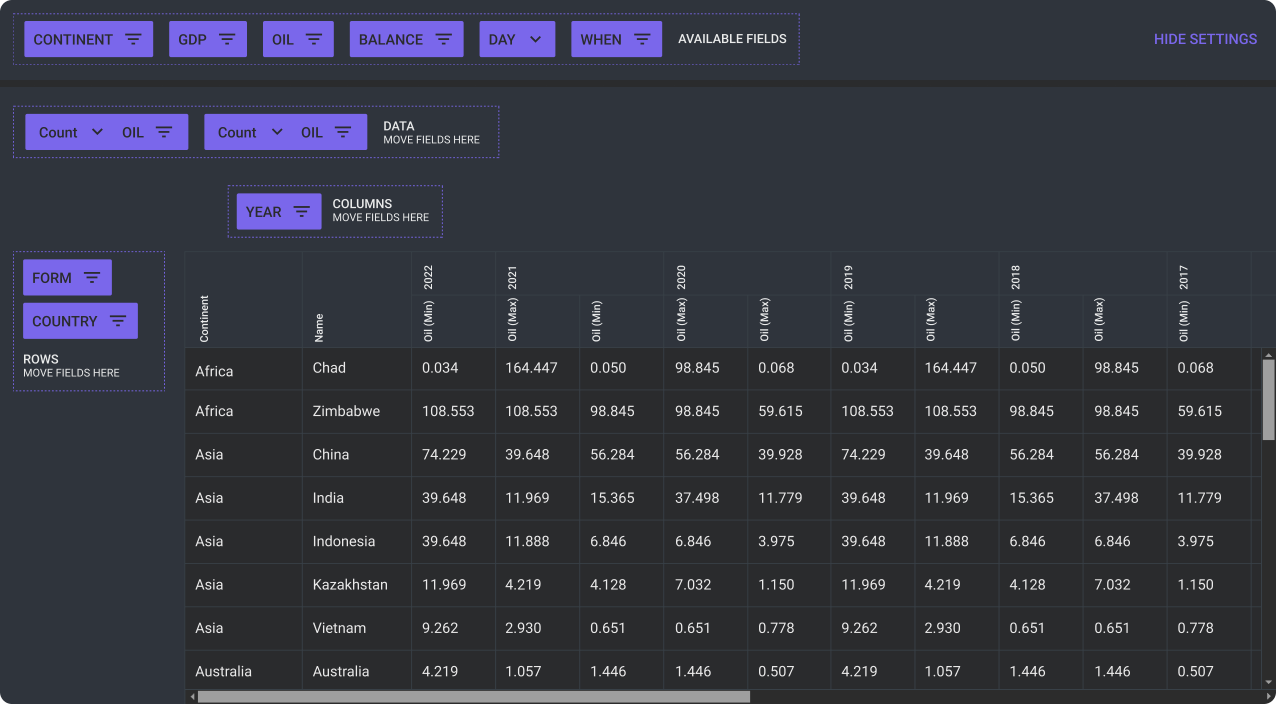
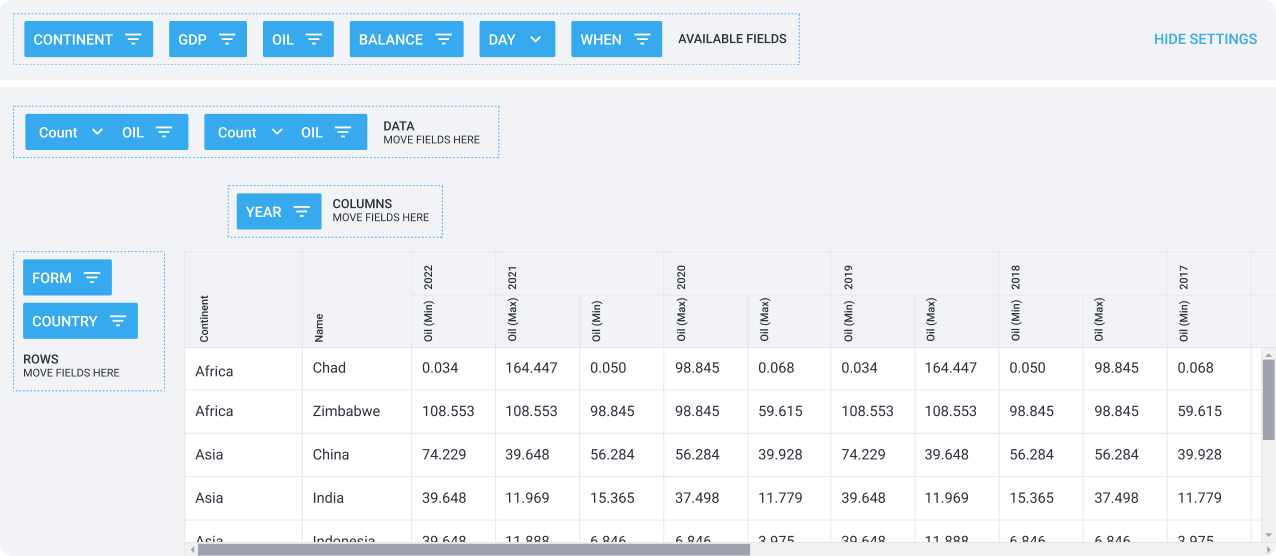
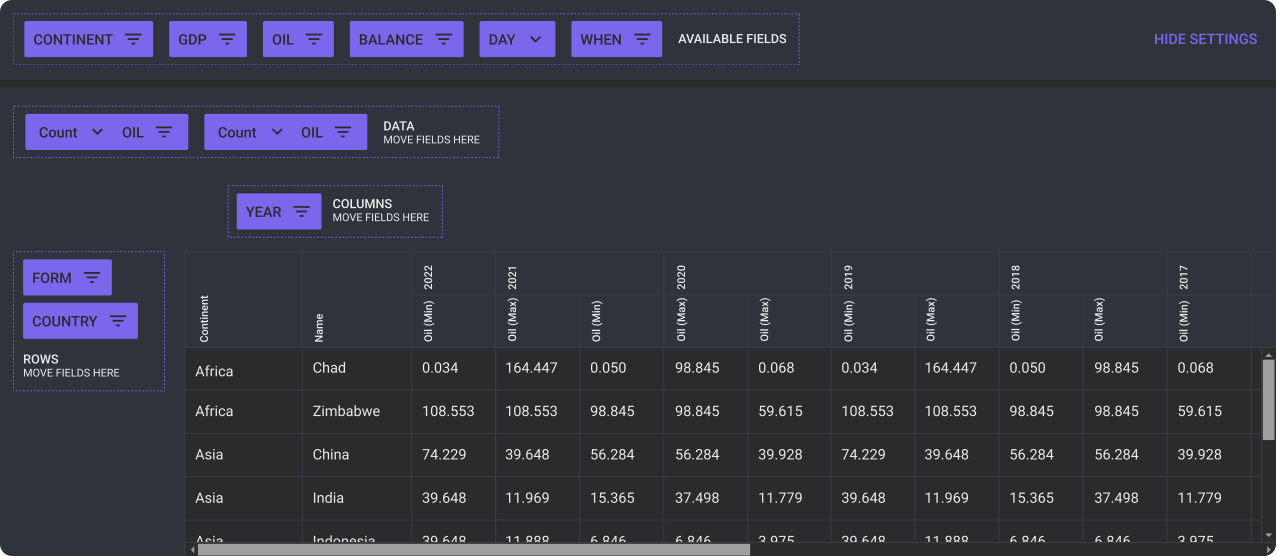
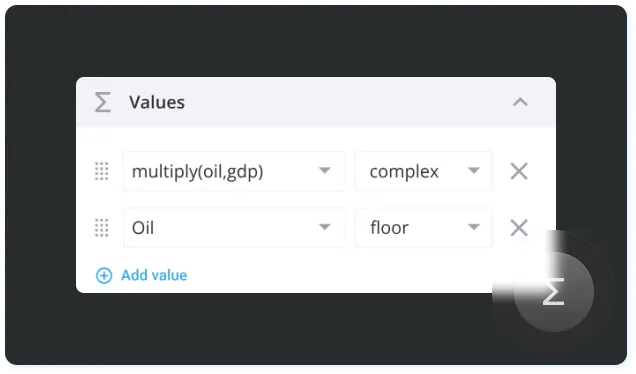
There are preset types of data operations (sum, max, min, and count), but our Svelte pivot table is very flexible, so you can also add your own operations to it. The resulting values of operations are displayed at the footer.
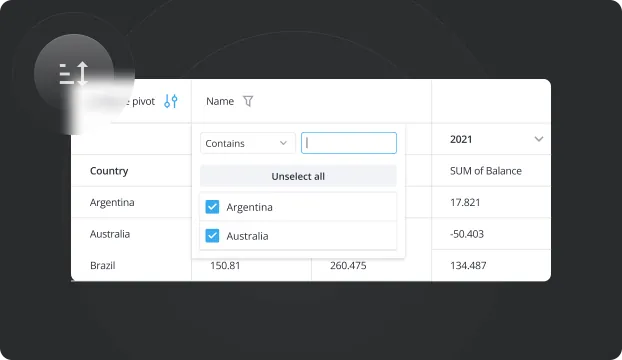
You can use filters to display only the data you want, or to extend or narrow your data search. Pre-defined filters (used prior to data aggregation) or dynamic UI components can be used to do this. A single click on the row's header will bring up icons for ascending and descending sorting.
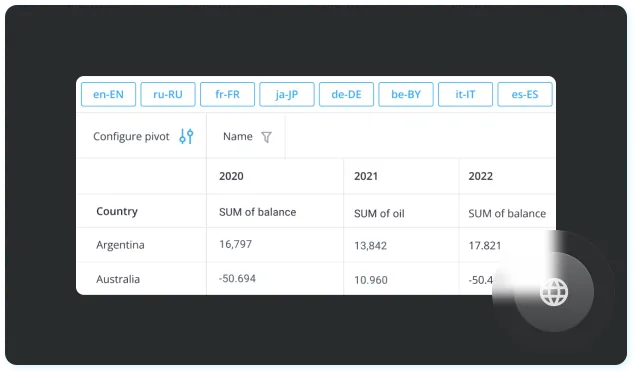
Related Pivot API can help to fully localize this Svelte pivot table to the end users. All the components will be displayed in the necessary language. And even currency symbols will be correctly changed respectively to the localization you select.
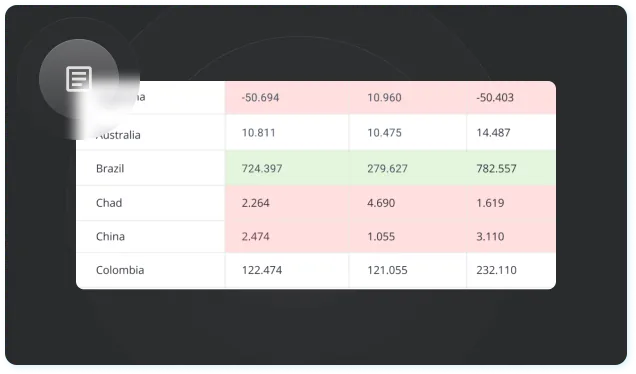
We provide ready-made structures for your reports. You can conveniently configure the report, highlight min and max values of the cells by different colors. Additionally, you can add any custom content for better presentation, such as checkboxes and other elements.