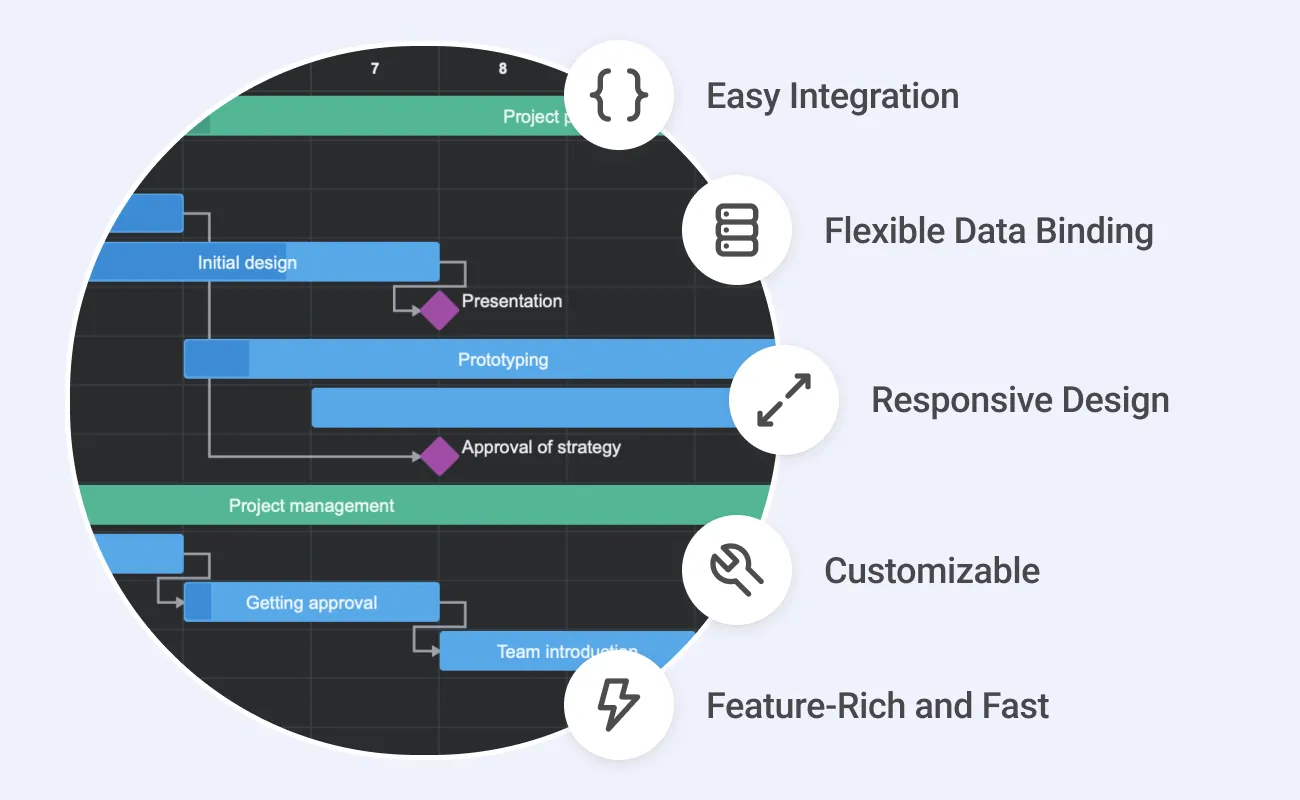
If you’re looking for an effective way to visualize project workflows, you can’t overlook the Gantt chart option. It has been used in project management for decades, helping teams plan tasks and track progress and performance. Starting from charts drawn on paper, the Gantt chart is now widely used in online software across various industries and still does its job effectively.
Modern project management software like Asana or Trello has made Gantt charts more interactive and easy to use. Users can now easily update task bars directly on the chart and assign as many additional data points as needed (e.g., resources, dependencies, milestones, cost estimates, etc.).
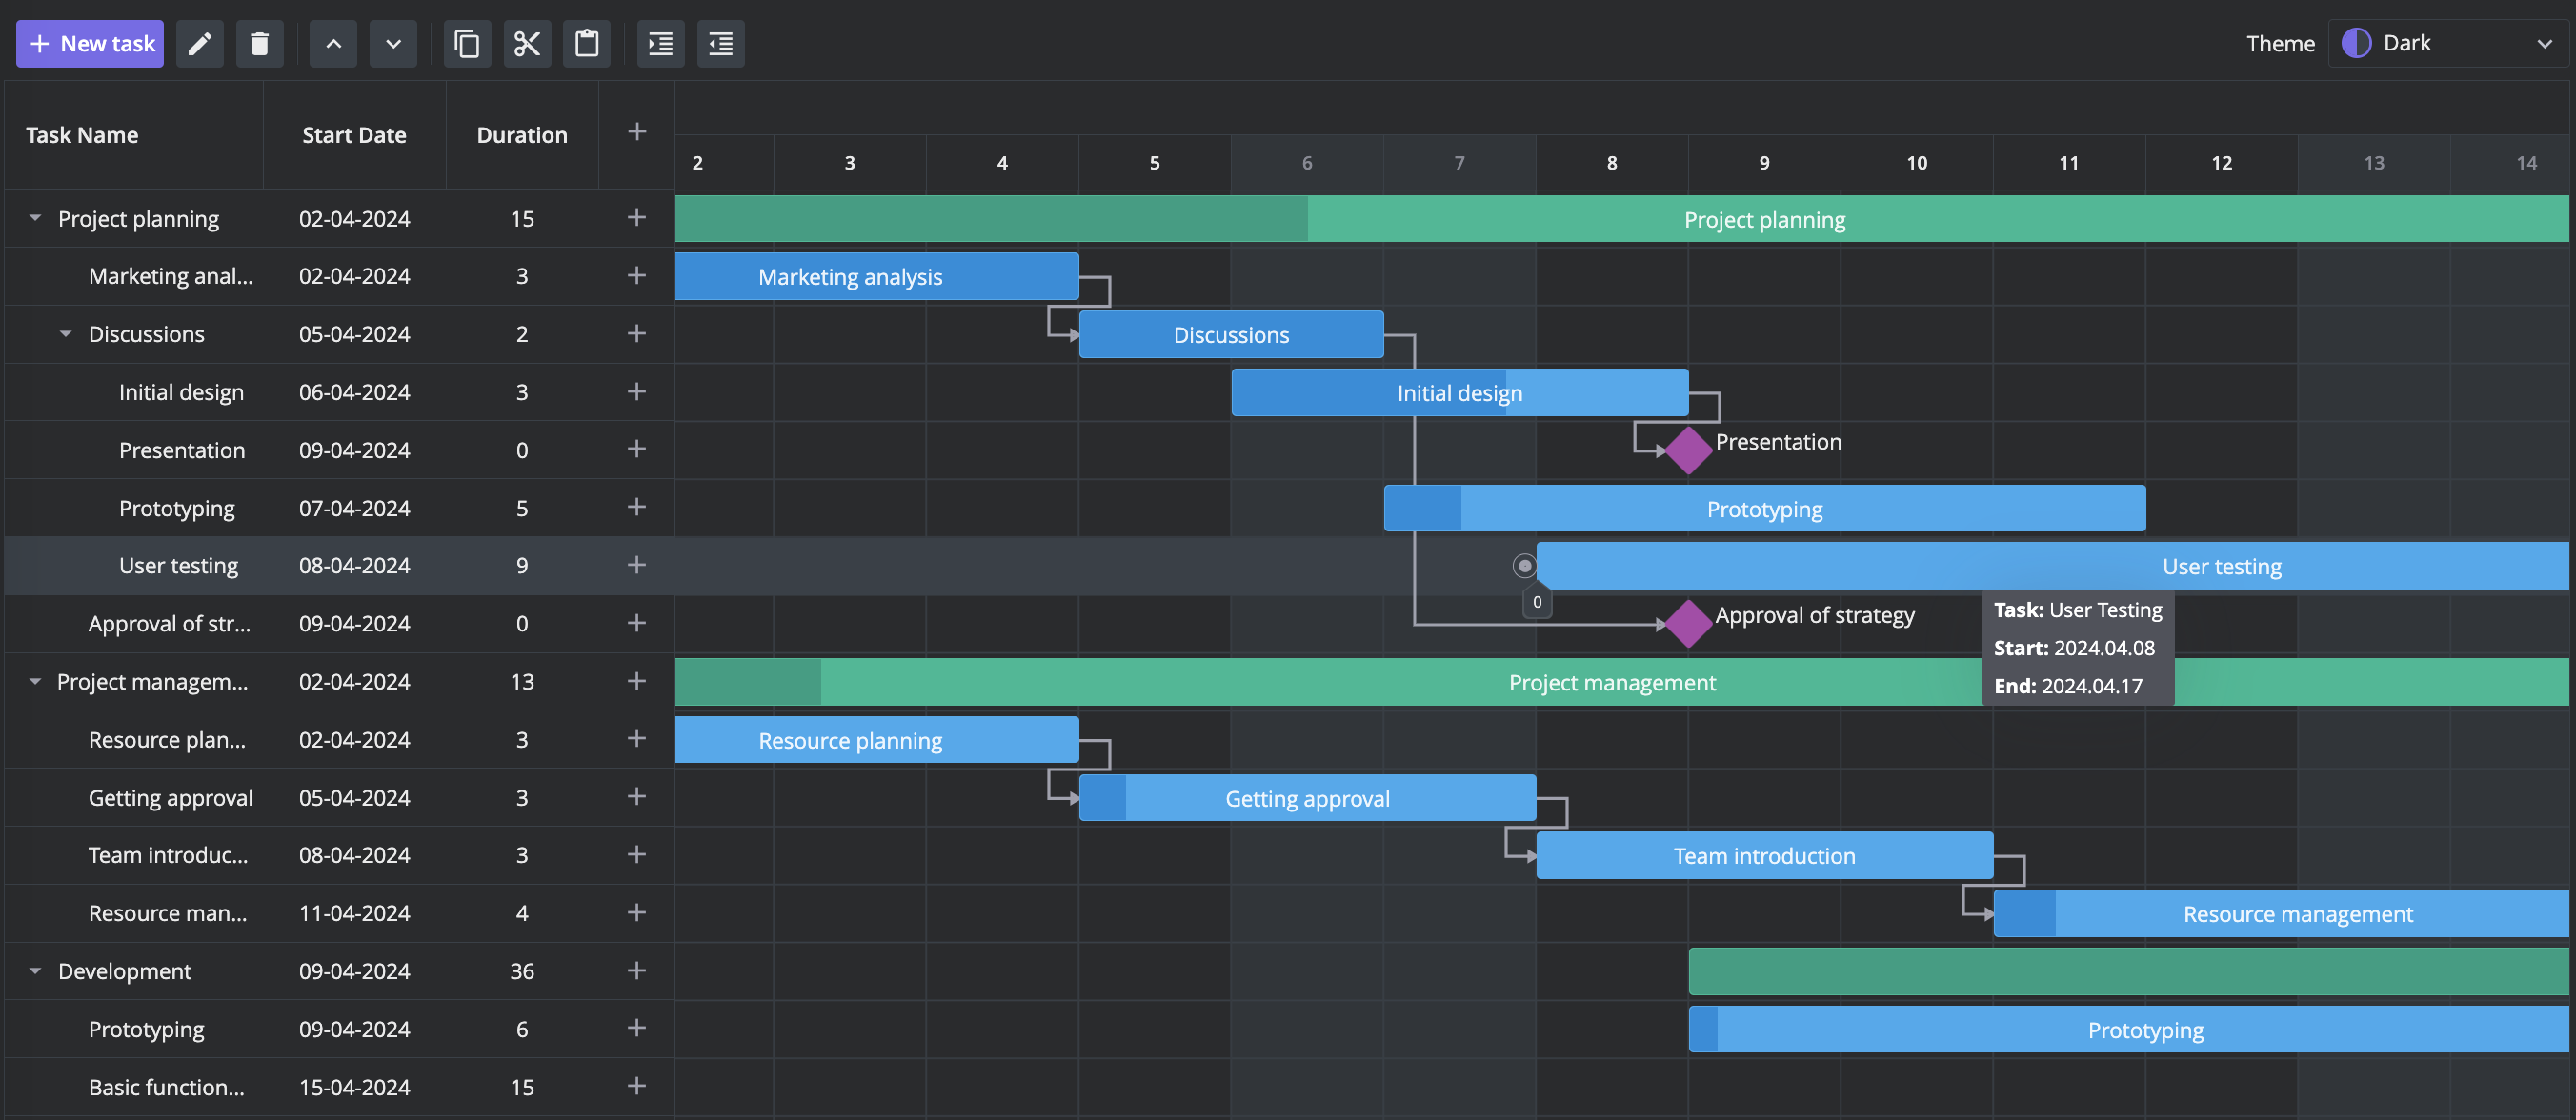
If you’re considering adding a project management feature to your app, Gantt charts offer a robust, time-tested solution. And if you need a modern user interface with easy integration, our free and open-source SVAR Svelte Gantt Chart should be on your radar. Here’s why:
Built with Svelte
SVAR Gantt Chart is built with Svelte, and its name speaks for itself. Since Svelte compiles code at build time and requires less code to achieve the same results as other frameworks, it enables smaller bundle sizes and faster runtime performance. Thanks to its Svelte foundation, SVAR Gantt is lightweight and delivers fast performance. Svelte’s efficient approach to updating the DOM ensures smooth scrolling and zooming, allowing the Gantt chart to handle large datasets, real-time updates, and complex visualizations with ease.
Moreover, syntax Svelte uses is close to vanilla JavaScript, HTML, and CSS, making it easier for web developers to adopt and reducing the time needed to implement and customize SVAR Gantt to your needs.
Easy Integration
Speaking about integration, it’s really easy to add a Gantt chart to your project. This is what you need is to install SVAR Svelte Gantt chart with npm:
npm install wx-svelte-ganttThen you just import the Gantt component. The code below creates an empty chart with the timescale and the area for tasks tree:
<script>  import { Gantt } from "wx-svelte-gantt";</script>
<Gantt />
The following example shows how to create a simple chart with one summary task (can be used to visualize the entire project) and two tasks included within it:
<script>  import { Gantt } from "wx-svelte-gantt";
  const tasks = [    {      id: 1,      text: "Plan Vacation",      start: "2024-05-01 00:00:00",      end: "2024-07-31 00:00:00",      duration: 91, // 3 months      progress: 0,      type: "summary",    },    {      id: 2,      text: "Book Flights and Accommodation",      start: "2024-05-01 00:00:00",      end: "2024-05-15 00:00:00",      duration: 14, // 2 weeks      progress: 0,      parent: 1,      type: "task",    },    {      id: 3,      text: "Pack and Prepare",      start: "2024-07-01 00:00:00",      end: "2024-07-31 00:00:00",      duration: 21, // 3 weeks      progress: 0,      parent: 1,      type: "task",    },  ];
  </script>
<Gantt {tasks} />
Loading data into the SVAR Gantt Chart is straightforward, allowing developers to efficiently populate the chart with tasks, set up links between tasks, and configure grid columns and time scales. Here you can find the detailed instructions.
Flexible Data Binding
You can load data to the Gantt chart from a local source, fetch it from a server, or even load it dynamically as needed. The flexibility of SVAR Gantt enables seamless integration with various data sources, giving you the freedom to connect it with any backend.
If you’re familiar with the Go programming language, you can grab the ready-made backend script for SVAR Svelte Gantt from GitHub. Otherwise, you need to create your custom server script.
To simplify backend data binding, we offer RestDataProvider, an independent service that helps you manage real-time updates and synchronization with the backend. Here is what it does:
- listens to user actions and sends REST requests to perform the corresponding data operations on the backend;
- provides a method for loading tasks and links from backend
- offers the debounce functionality to avoid excessive server requests.
More on backend data binding can be found in the corresponding section of the documentation.
Responsive Design
SVAR Gantt is built to be responsive and adaptive to different screen sizes and devices. While it looks best on larger screens due to its complex visual components, it can also be adapted for smaller tablet and smartphone screens.
On narrower screens, the grid part hides under the burger menu and SVAR Gantt displays only task bars and time scale. Users can still create independent tasks (via a plus icon at the bottom of the screen) and add subtasks within the list. SVAR Gantt is touch-friendly, allowing users to move task bars, edit tasks and dependencies on touch screens with ease.
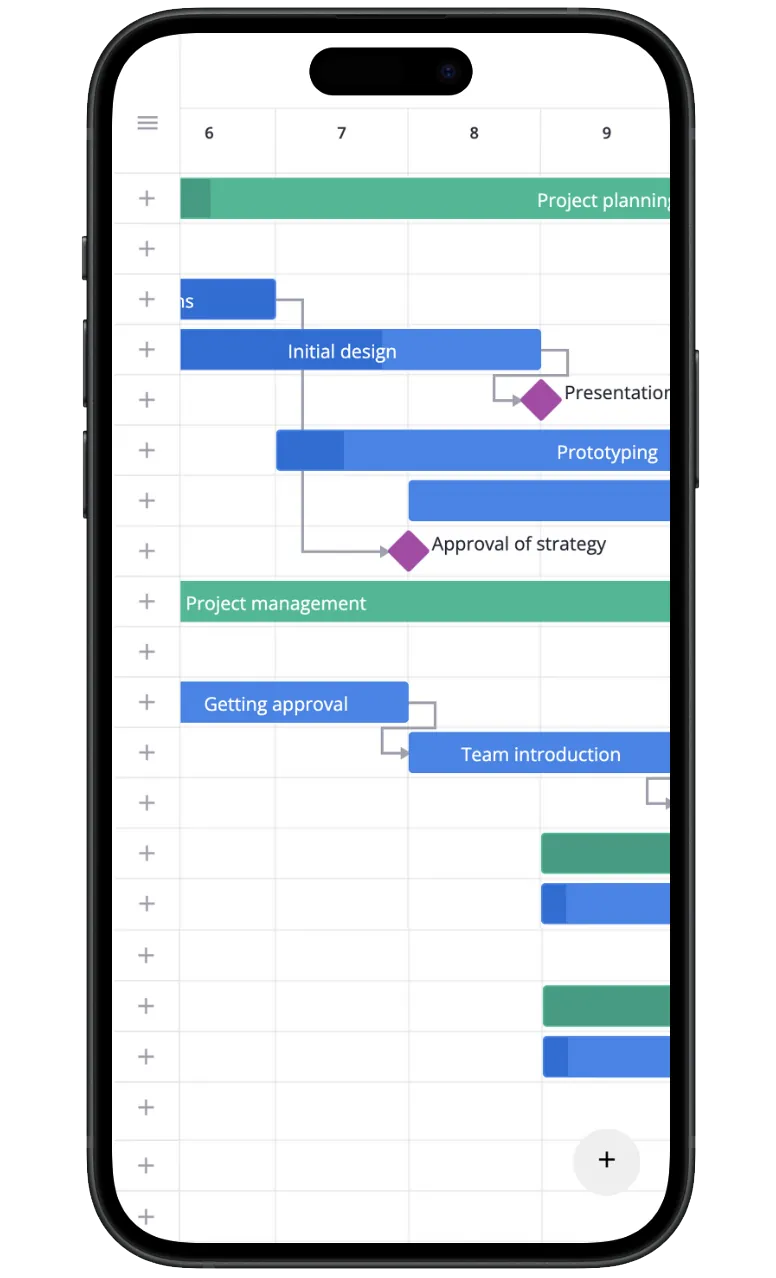
If you know that the Gantt chart will be used on smaller screens, you can customize the time scale to display larger time steps (e.g., weeks instead of days) and increase the height of rows and task bars for better user convenience.
Customization
When it comes to customization, SVAR Gantt offers a flexible API that allows you to adjust its look and feel to your app’s specific requirements. Clear, comprehensive documentation for all customization options is also at your disposal.
You can define how the time scale looks by adjusting time units (e.g., days, weeks, months), setting a custom date range for the timeline, and styling individual time scale cells, like highlighting weekends. Additionally, the scale height can be modified to ensure the chart layout is optimized for different screen sizes and project needs.
You can also customize the appearance of the task bars, create task templates for different types of activities and add tooltips to provide detailed information on each task.
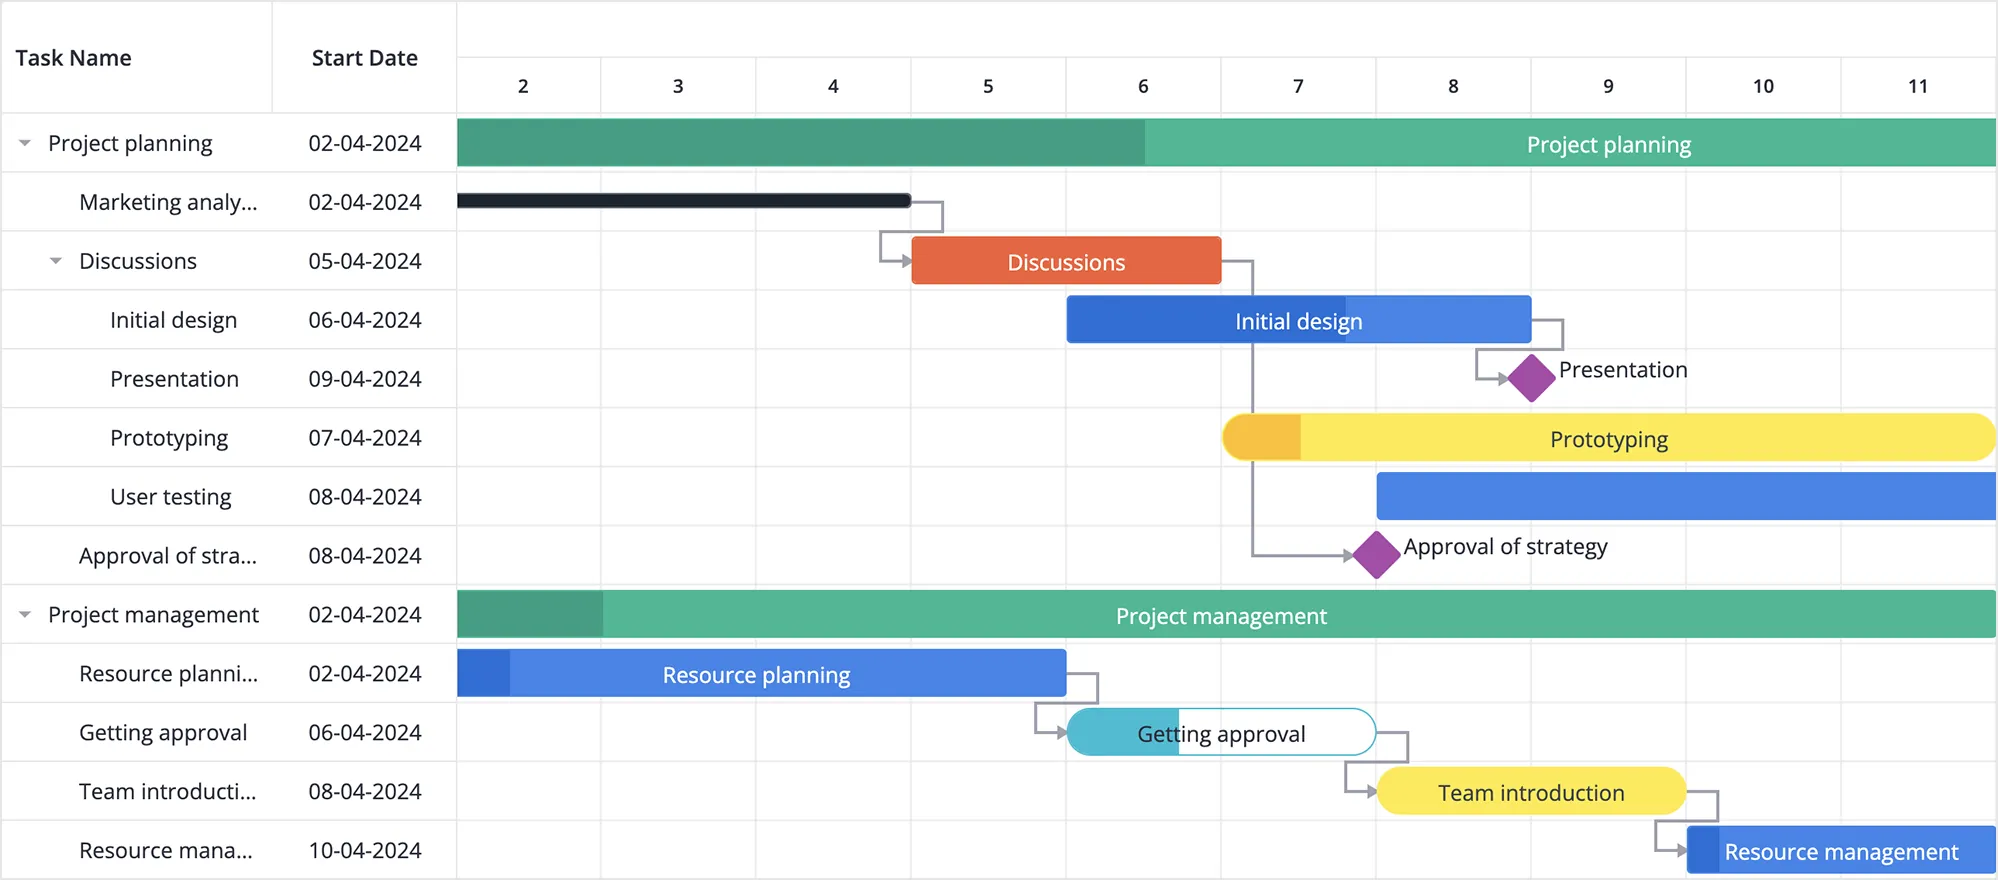
The columns in the task tree can be adjusted to display the data relevant to your project, while collapsible rows allow you to organize the subtasks in a compact way.
The task editing form is also configurable, allowing you to choose the fields you need to display. By default, the editing form appears as a slide-in panel but you can also attach your custom popup form.
Finally, SVAR Gantt allows you to add a custom locale and present the chart interface in different languages.
Feature Set and Performance
SVAR Gantt supports advanced drag-and-drop functionality, allowing users to easily adjust task dates, durations, and dependencies directly on the chart, as well as reorder tasks in the task tree. An intuitive task editing form provides users with an easy way to edit task details and change the progress of a task.
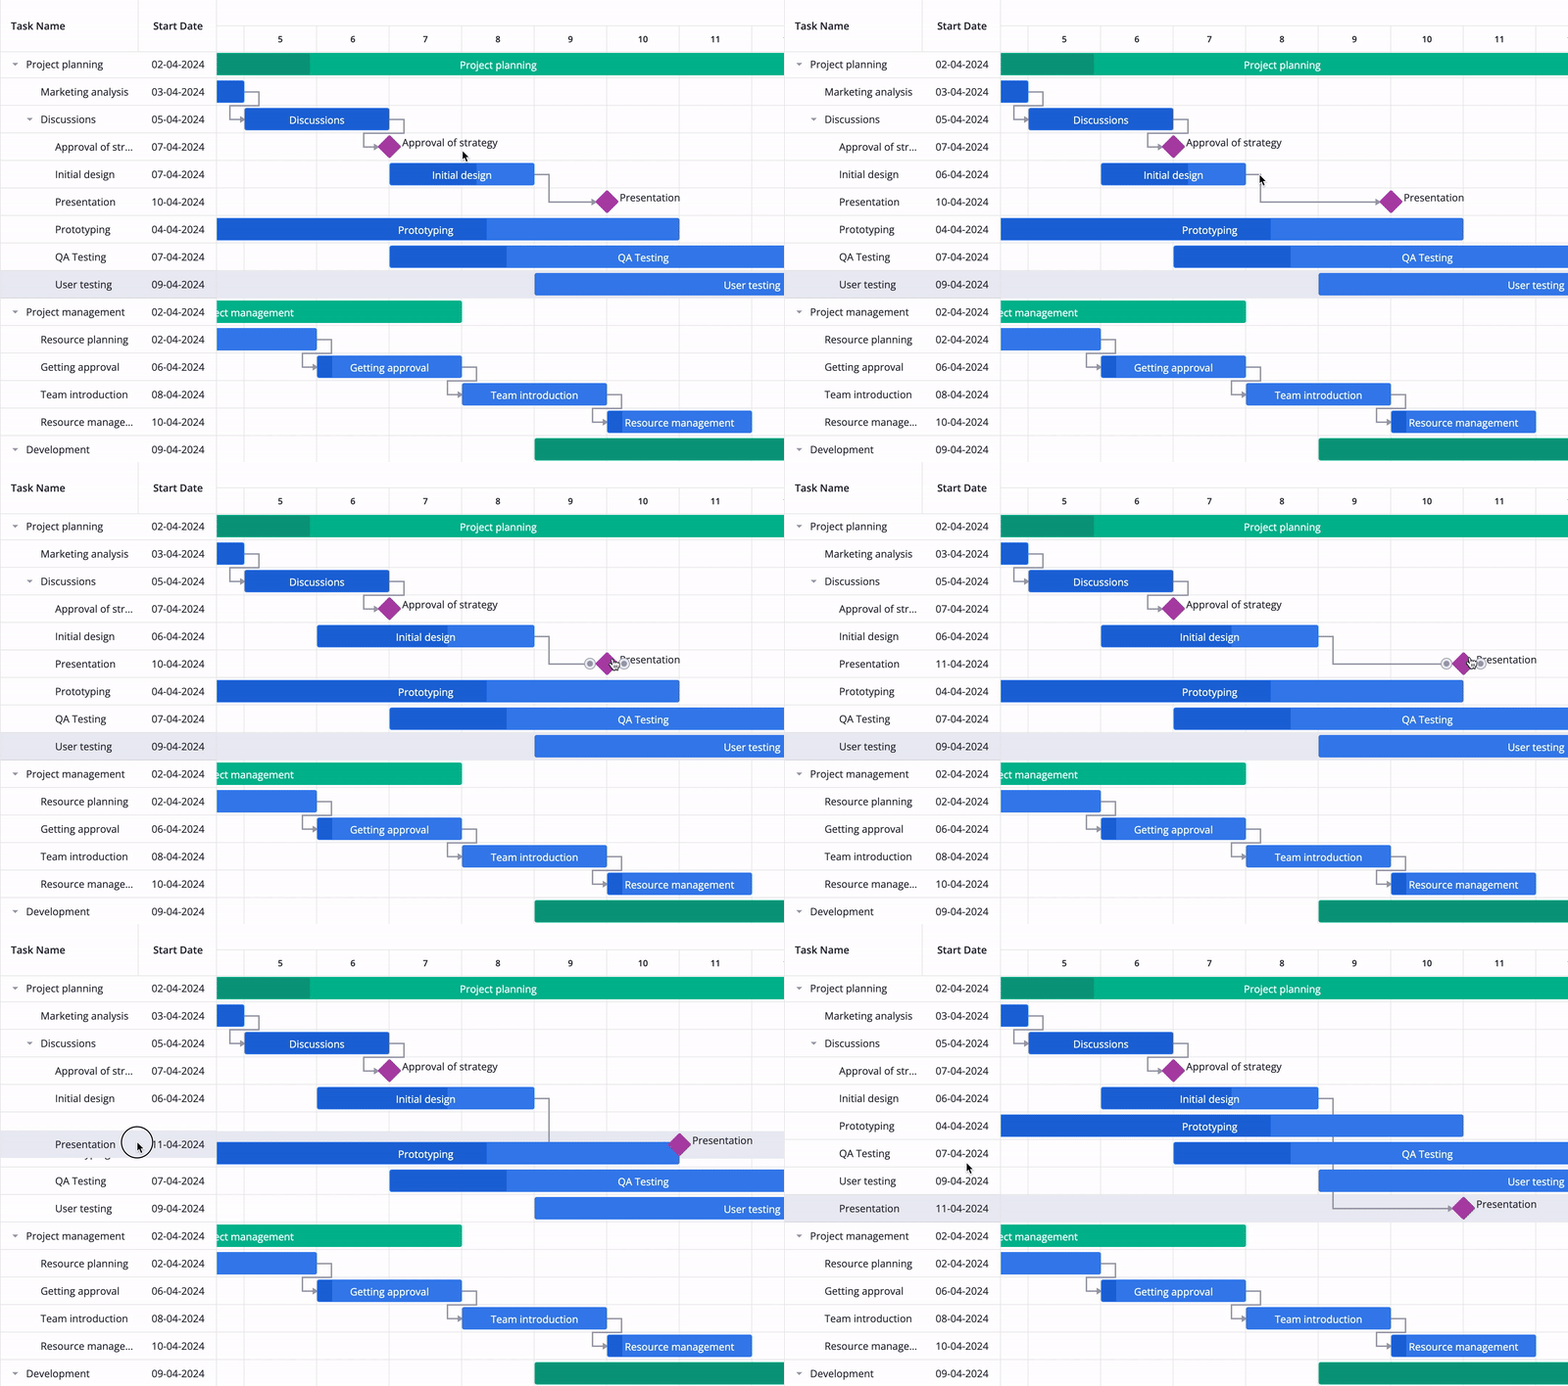
SVAR Gantt also allows users to define the time range to view tasks within a specific period, zoom the chart with a mouse wheel, and use the context menu or toolbar to access essential task operations (add, edit, delete, etc.).
When displaying large datasets, SVAR Gantt renders data incredibly fast and effectively. If needed, you can also load subtasks dynamically on demand, shortening the initial load time. There is no need to worry about performance issues when using SVAR Gantt.
A demo worth a thousand words, so check out the live demos and see for yourself how intuitive and fast-performing SVAR Gantt is.
Documentation and Support
We haven’t just created a great tool for Svelte Gantt charts — we’ve backed it with detailed, well-structured documentation, comprehensive API references, and step-by-step guides to help you understand Gantt’s features and integrate it seamlessly into your apps.
In addition to the community forum, we also provide professional support and integration services. Just contact us if you need help, leave feedback or would like to chat about our products.
Stop Reading and Start Using SVAR Gantt
Gantt charts remain a popular tool for project management visualization. They provide a clear, visual representation of project timelines and task dependencies, making it easy to see the status of tasks and overall project progress at a glance.
SVAR Svelte Gantt is an ideal choice for web developers working within the Svelte framework. Unlike its competitors, it is not overloaded with features and visual clutter. And it can be a great advantage if you need an easy to use, lightweight, and high-performance Gantt chart for your project. So start with an easy getting-started guide and don’t forget to give us a star on GitHub :)


