

If you’re building a project management app, or just need to visualize tasks and timelines, you’ll most likely end up with a Gantt chart component. There are about half a dozen popular options for React, and I tested all of them.
I ran the tests in real-world scenarios: loading large datasets, handling live updates, and CRUD operations that mimic actual user workflows. The results were… educational. Some of these libraries will cost you thousands of dollars a year in licensing, and they can’t even handle a mid-size dataset without choking. Let me save you the trouble.
Top React Gantt Chart Libraries to Be Tested
Here’s who showed up:
- DHTMLX – been around since the jQuery days, a powerful vanilla JS Gantt chart with a React wrapper on top
- Bryntum – another feature-rich veteran, also vanilla JS with a React wrapper
- Syncfusion – enterprise suite player, hard to tell what’s going on under the hood (no proper source to analyze)
- DevExtreme – same story, closed-source enterprise component with a decent feature set
- KendoReact – from Telerik, this one is actually a pure React component, but weaker functionality compared to others
- SVAR React Gantt – the newcomer, built for React from day one, and actively adding the new features
Being built in React matters more than you’d think. DHTMLX and Bryntum are vanilla JavaScript solutions that added React wrappers - an architectural approach that shapes their performance profile in interesting ways.
Kendo is genuinely React inside, and Syncfusion and DevExtreme - who knows, the source isn’t available for proper analysis. SVAR is the only one that was born in the recent React era, designed from scratch as a reactive component.
We’re about to see exactly how that architectural choice plays out under pressure.
Raw Loading Speed
I loaded datasets ranging from 1,000 to 100,000 tasks and measured how long each library takes to render. Where supported, dynamic (virtual) rendering was enabled – most of the reviewed Gantt chart libraries can do it.
Every dataset uses the same structure: flat tasks (no hierarchy) with 2-day durations, spread across a 2-year timeline on a day scale. Each task has a finish-to-start dependency linking it to the previous task, so you get a full chain of dependencies across the entire dataset.
This is deliberately simple data – there are no nested subtasks, no resource assignments, no constraints. The goal is to isolate raw rendering and data processing performance, not to test scheduling logic.
Raw Loading Speed Comparison
| Library | 1k | 5k | 10k | 50k | 100k |
|---|---|---|---|---|---|
| SVAR | 72 ms | 140 ms | 220 ms | 900 ms | 1,700 ms |
| DHTMLX | 70 ms | 160 ms | 450 ms | 7,076 ms | 26,950 ms |
| Bryntum | 848 ms | 2,945 ms | 5,710 ms | 32,226 ms | — |
| Bryntum (first paint) | 300 ms | 1,000 ms | 1,500 ms | 4,000 ms | 10,000 ms |
| Kendo | 4,350 ms | — | — | — | — |
| Syncfusion | 141 ms | 449 ms | 1,153 ms | error | error |
| DevExtreme | 108 ms | 933 ms | 3,141 ms | — | — |
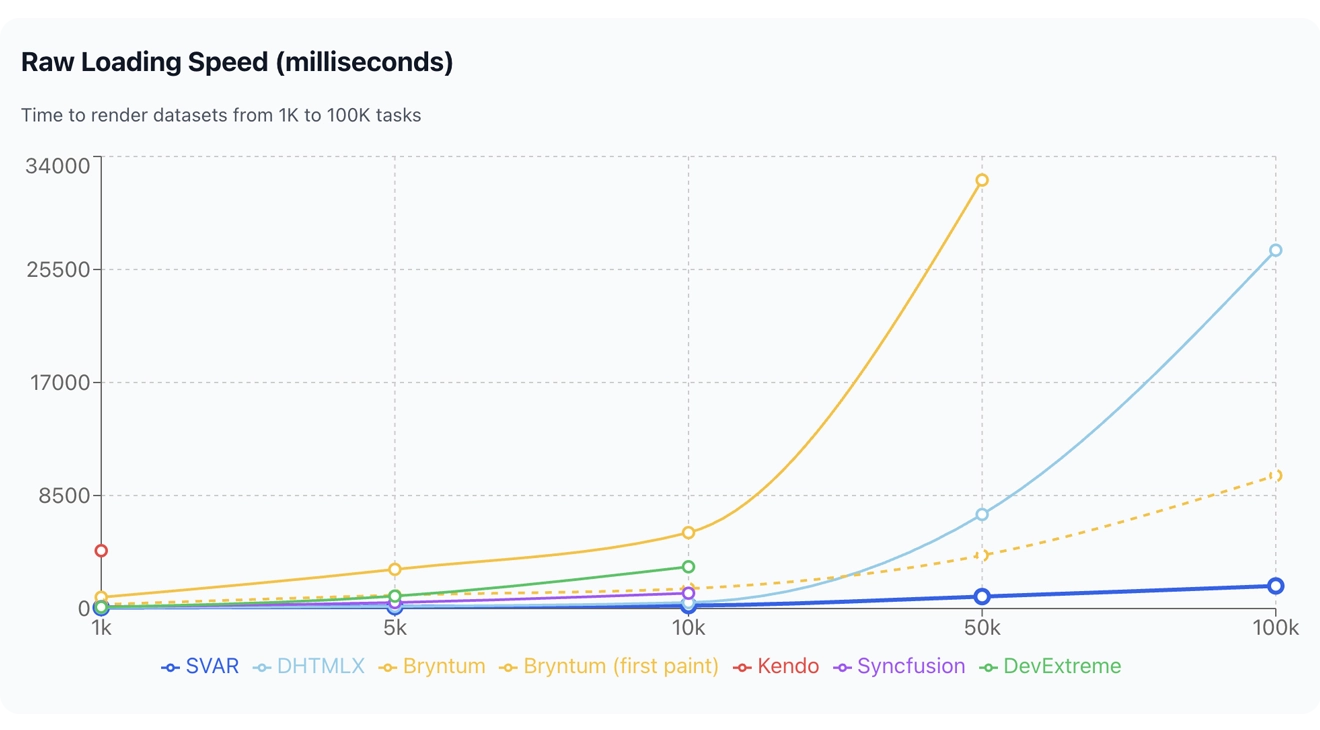
At 1,000 tasks, most Gantt chart libraries are fine. Loading in about 100 ms is a perfectly acceptable result, and almost everyone hits that mark. Kendo doesn’t – it takes over 4 seconds to load a thousand tasks. Four seconds. For a thousand rows. I stopped testing it at larger sizes because there was no point.
Things get interesting as datasets grow. DHTMLX and SVAR Gantt charts stay neck and neck up to about 10k tasks, then DHTMLX shows declining performance at larger scales. DevExtreme degrades even faster. Both of them have built-in scheduling engines that you can’t fully disable, and those engines run even when you don’t need them, dragging the whole render down for no real benefit.
At 50k tasks, the field thins out fast. Most libraries either become unusable or weren’t tested because I’d still be waiting. SVAR Gantt crosses the 1-second line at 100k tasks, settling at 1.7 seconds. That’s not instant, but it’s a reasonable wait, as the user sees their data in a moment. Compare that to DHTMLX Gantt at nearly 27 seconds.
Bryntum deserves a special note. It renders in two phases: raw data first, then a rescheduling pass (even if all tasks are marked as unscheduled – it doesn’t care, it runs the scheduler anyway), then the final paint. The “first paint” numbers look better, but they’re misleading. The browser is locked until the full cycle completes. So that 848 ms at 1k? Your user is actually frozen for that entire time.
And Syncfusion? It’s the only library that throws a stack overflow error on large datasets. Not slow or degraded, just crashed. That’s a special kind of bad.
And keep in mind – these numbers are from a fast desktop machine. On a mid-range laptop or a tablet, you’ll hit the same performance walls at much smaller datasets. That 10k threshold where most libraries start struggling? On slower hardware, it might be 2k.
Scrolling Speed
Once data is loaded, you need to scroll through it. I measured frames per second during continuous vertical scrolling across all dataset sizes.
Scrolling Speed Comparison
| Library | 1k | 5k | 10k | 50k | 100k |
|---|---|---|---|---|---|
| SVAR | 60 fps | 45 fps | 30 fps | 10 fps | 5 fps |
| DHTMLX | 60 fps | 60 fps | 60 fps | 60 fps | 60 fps |
| Bryntum | 60 fps | 60 fps | 60 fps | 60 fps | — |
| Kendo | 60 fps | — | — | — | — |
| Syncfusion | — | — | — | — | — |
| DevExtreme | 60 fps | 33 fps | 17 fps | — | — |
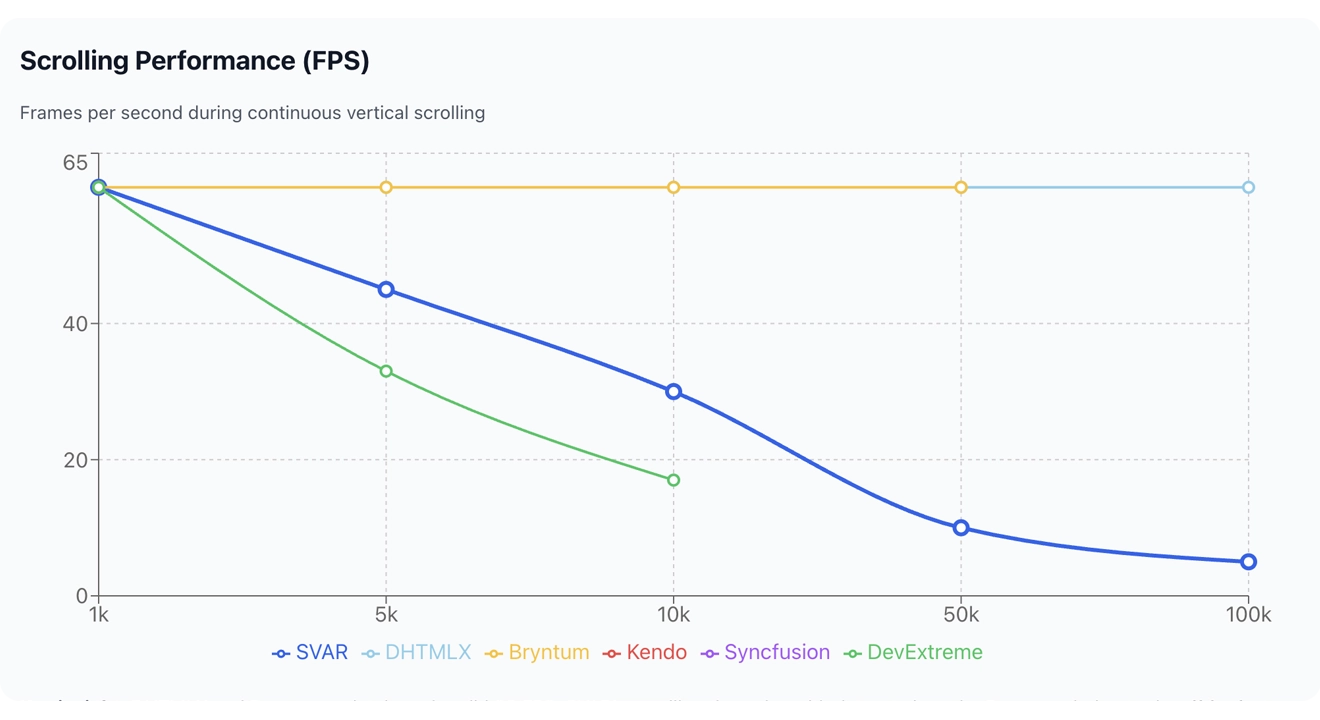
DHTMLX and Bryntum Gantt charts absolutely nail this. Rock-solid 60 fps at every dataset size. If you’d managed to sit through the loading time, at least scrolling is buttery smooth. Their vanilla JS rendering pipelines are doing exactly what they were designed to do.
SVAR Gantt’s story flips here. While it loads data fast, repainting during scroll is not as optimized. After 10k rows, it drops hard to 10 fps at 50k, 5 fps at 100k. The results are usable for most real-world datasets, but it’s clearly the weak spot.
DevExtreme Gantt degrades steadily and becomes unusable past 10k.
Syncfusion Gantt isn’t in the table because I couldn’t measure it. It doesn’t repaint while you scroll. Instead, it shows a splash screen overlay and redraws everything after you stop scrolling, which is a cheap trick. Technically there’s no jank because there’s no rendering happening. But your users are looking at a blank placeholder every time they flick the scrollbar. That’s not a solution, it’s hiding the problem.
CRUD Operations
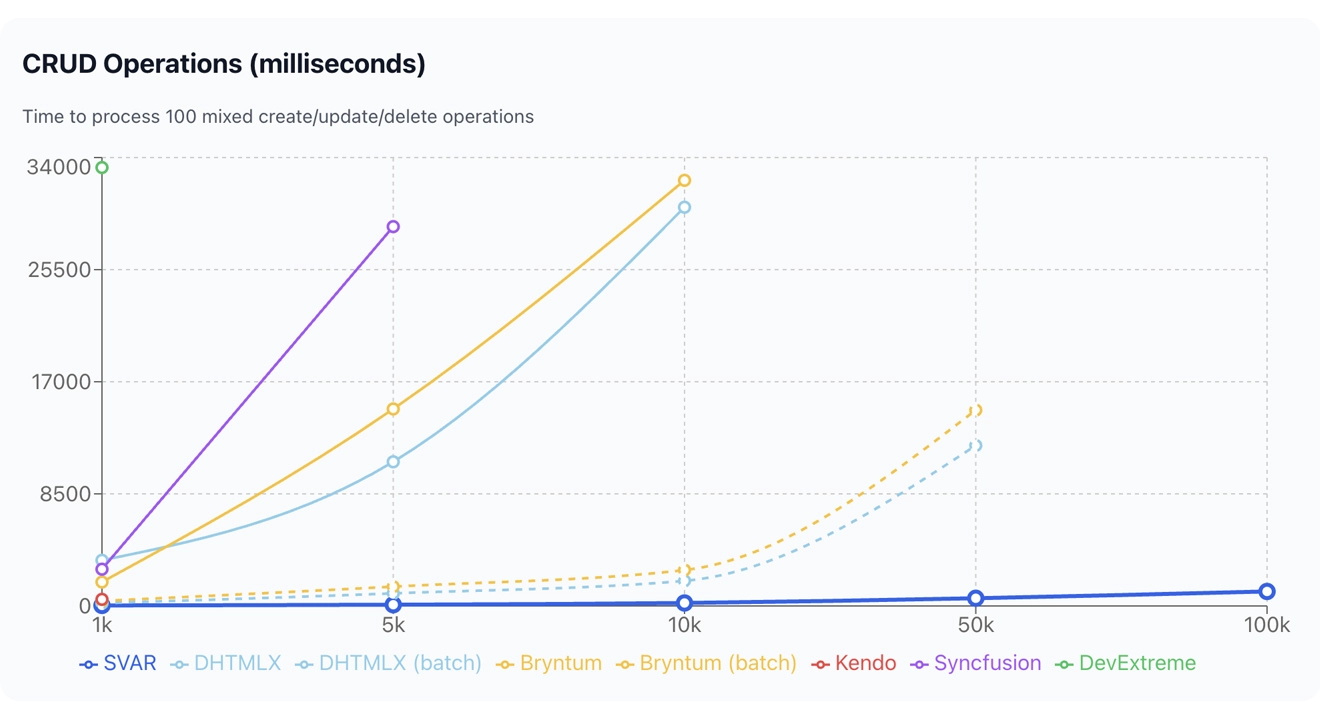
This is where things get really interesting. I ran 100 iterations of mixed CRUD operations against the loaded dataset and measured how long the whole batch takes to process.
Each iteration updates one existing task (shifting its start date by one day and renaming it), deletes another task from the dataset, and adds a new task with a dependency to the previously added one. So across the full test, that’s 100 updates, 100 deletes, and 100 inserts – a realistic burst of changes, like importing a batch of edits from a server or processing a bulk user action.
CRUD Operations Comparison
| Library | 1k | 5k | 10k | 50k | 100k |
|---|---|---|---|---|---|
| SVAR | 40 ms | 95 ms | 226 ms | 585 ms | 1,100 ms |
| DHTMLX | 3,463 ms | 10,931 ms | 30,233 ms | — | — |
| DHTMLX (batch) | 211 ms | 955 ms | 1,904 ms | 12,168 ms | — |
| Bryntum | 1,816 ms | 14,936 ms | 32,272 ms | — | — |
| Bryntum (batch) | 380 ms | 1,466 ms | 2,721 ms | 14,854 ms | — |
| Kendo | 500 ms | — | — | — | — |
| Syncfusion | 2,787 ms | 28,763 ms | — | — | — |
| DevExtreme | 33,242 ms | — | — | — | — |
When it comes to CRUD operations, here is where the React-first architecture pays off in a big way.
In a true React component, like SVAR React Gantt, rendering and data updates are separate concerns. You update state, React figures out what changed, and it repaints the minimum necessary DOM. That’s how SVAR Gantt works: without any special API, all updates are batched through normal reactive logic. Result: 40 ms for a hundred CRUD operations, essentially instant.
DHTMLX and Bryntum, with their vanilla JS cores, rely on dedicated APIs for updates. Using defaults: DHTMLX Gantt takes 3.5 seconds, Bryntum Gantt 1.8 seconds for 1,000 operations. That’s 50x–90x slower than SVAR, since each individual operation triggers a full internal update cycle.
Both libraries offer a batch update API specifically for this scenario, and it kind of helps. DHTMLX drops from 50x slower to about 5x slower. Bryntum goes from 90x slower to about 10x slower. Better, sure. The thing is - you have to know the batch API exists and restructure your code to use it, and you’re still much slower.
Kendo shows a surprising result here: 500 ms at 1k isn’t great, but it’s vastly better than its terrible loading performance would suggest. It probably uses proper React internals for updates, even if its initial render is a disaster.
DevExtreme takes 33 seconds for 100 CRUD operations at 1k scale. Thirty-three seconds for a hundred create/update/delete operations. I don’t have a polite word for this. It’s broken. I wouldn’t use their Gantt chart for any app that changes data.
Live Updates
Gantt charts are often used in multi-user environments with real-time collaboration and live data feeds from a server. I measured frames per second while pushing continuous updates to the component.
The test updates 10 tasks on every animation frame, changing both the task name and shifting the start date forward by one hour. This simulates a steady stream of incoming changes, like a WebSocket feed pushing live progress updates or multiple users editing the same project simultaneously.
The key metric here is how many frames per second the component can sustain while absorbing these changes without dropping below a usable refresh rate.
Live Updates Speed Comparison
| Library | 1k | 5k | 10k | 50k | 100k |
|---|---|---|---|---|---|
| SVAR | 60 fps | 30 fps | 15 fps | 5 fps | 3 fps |
| DHTMLX | 50 fps | 18 fps | 7 fps | 0 fps | 0 fps |
| DHTMLX (batch) | 60 fps | 20 fps | 7 fps | 0 fps | — |
| Bryntum | 30 fps | 10 fps | 5 fps | 0 fps | — |
| Bryntum (batch) | 25 fps | 8 fps | 0 fps | — | — |
| Kendo | 10 fps | — | — | — | — |
| Syncfusion | 5 fps | 0 fps | — | — | — |
| DevExtreme | 1 fps | 0 fps | 0 fps | — | — |
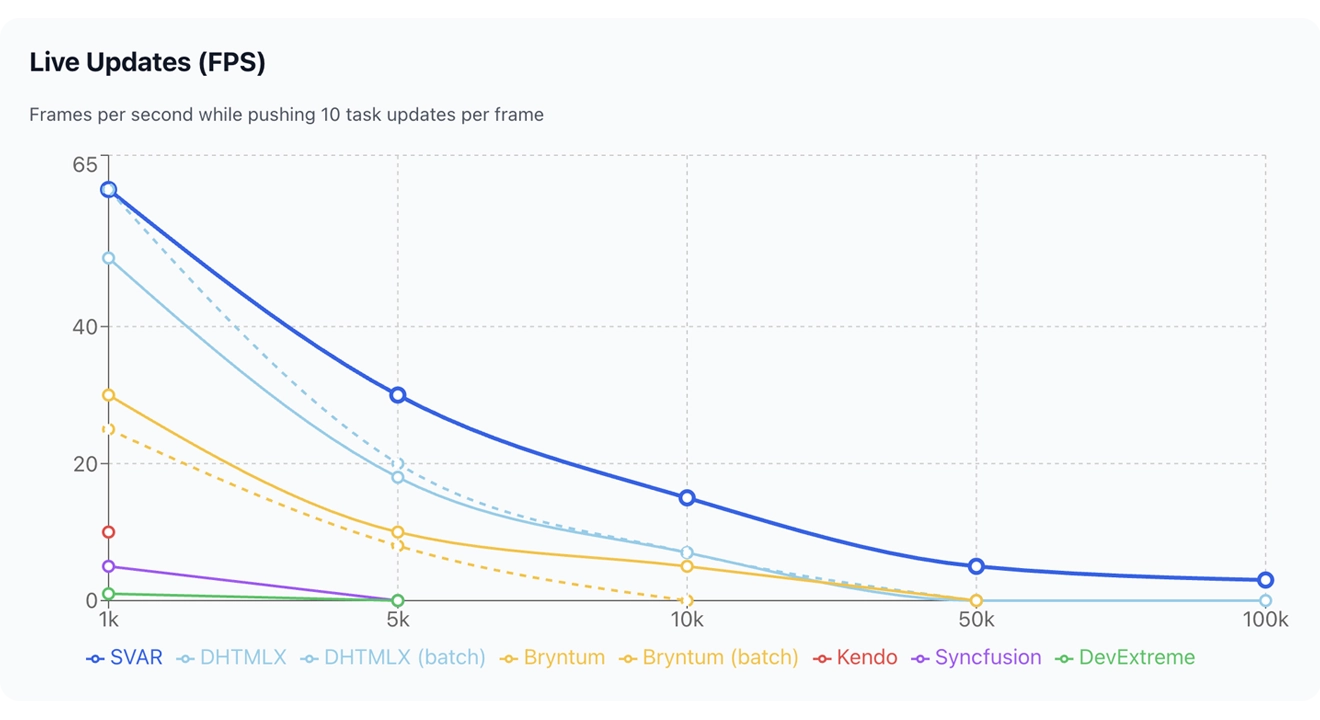
Same story, different angle. SVAR React Gantt is the only Gantt chart library that hits 60 fps at 1k. It’s the only one that provides tolerable update rates up to 10k rows. The numbers degrade at bigger datasets, but at least there are numbers. Other libraries go below the 1fps to a flatline at zero.
An interesting detail about Bryntum: its batch mode is actually slower for live updates than the default API. That’s probably because individual field updates (text, dates) are highly optimized in normal mode, while batch calls trigger the scheduler.
DHTMLX’s batch mode barely makes a difference here. 60 vs 50 fps at 1k, identical at 10k and beyond.
Kendo, Syncfusion, and DevExtreme Gantt charts? Don’t even think about using them for live update scenarios. Kendo manages 10 fps at the smallest dataset. Syncfusion hits 5 fps. DevExtreme delivers one frame per second – that looks more like a slideshow than animation.
Memory Usage
Memory is usually not the bottleneck. A typical web page already consumes plenty of RAM, so the library adds relatively little to the total. Most entries here are unremarkable.
Memory Usage Comparison
| Library | 1k | 5k | 10k | 50k | 100k |
|---|---|---|---|---|---|
| SVAR | 20 MB | 28 MB | 56 MB | 184 MB | 380 MB |
| DHTMLX | 15 MB | 25 MB | 30 MB | 68 MB | 88 MB |
| Bryntum | 100 MB | 245 MB | 600 MB | 1,800 MB | — |
| Kendo | 94 MB | — | — | — | — |
| Syncfusion | 37 MB | 53 MB | error | error | error |
| DevExtreme | 28 MB | 34 MB | 60 MB | — | — |
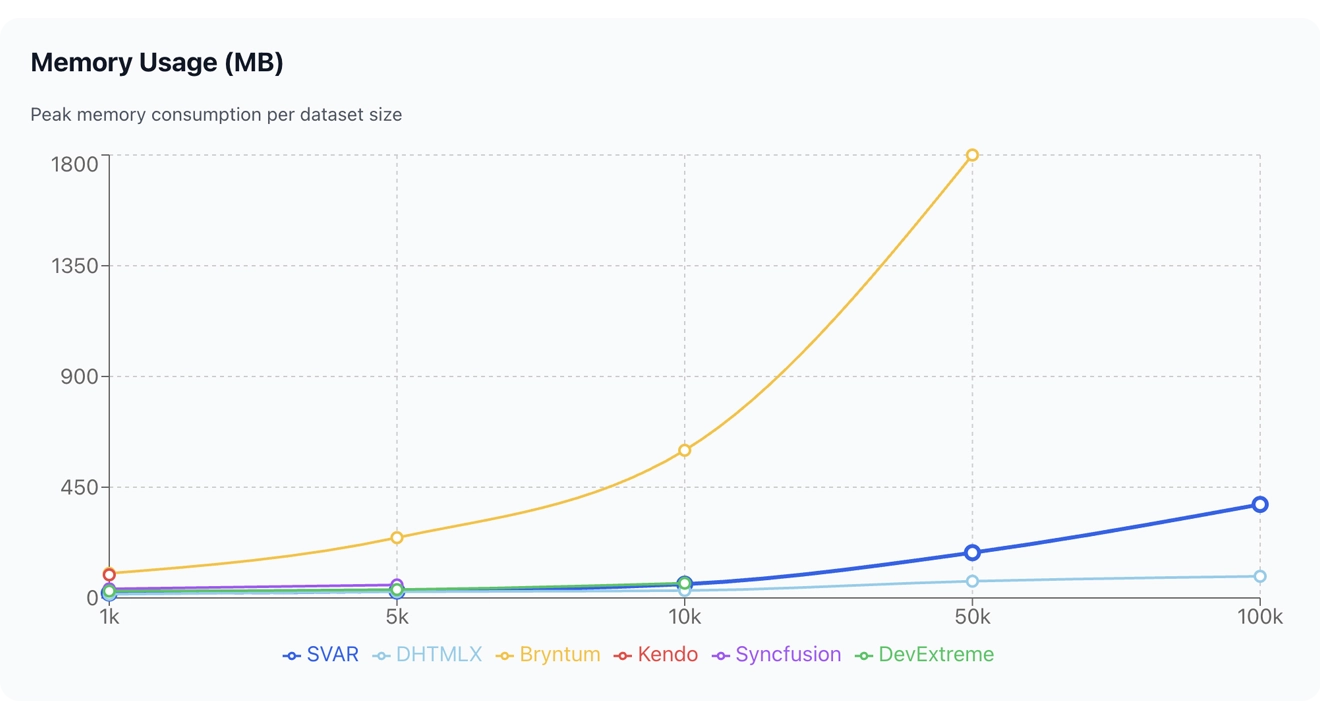
The only surprising exception is Bryntum. It uses 1.8 GB for 50k rows, which is roughly 36 KB per task row. I have no idea where it all goes. On a machine with 8 GB of RAM, Bryntum Gantt alone would eat nearly a quarter of total system memory for a single browser tab. Something to think about.
DHTMLX Gantt is a clear winner here - its 88 MB for 100k rows is impressively lean. SVAR and DevExtreme are in the reasonable middle ground, and Syncfusion crashes before it can even register a meaningful number.
So Which React Gantt Chart is the Fastest?
Here is the list of winners by category:
| Category | Winner 🥇 |
|---|---|
| Loading speed | SVAR |
| Scrolling | DHTMLX, Bryntum |
| CRUD operations | SVAR |
| Live updates | SVAR |
| Memory efficiency | DHTMLX |
Want to verify these results yourself? Check out the benchmark demo on GitHub.
SVAR React Gantt takes three out of five categories, being the fastest React Gantt chart in terms of loading speed, CRUD operations, and live updates. DHTMLX Gantt wins the memory usage category and shares the scrolling crown with Bryntum. Nobody else wins anything.
The pattern is clear. The React-first architecture gives SVAR React Gantt a massive edge in anything involving data changes: loading, CRUD, live updates.
The old-school vanilla JS wrappers (DHTMLX, Bryntum) excel at pure rendering tasks and have the perfect scrolling behavior, because their hand-tuned DOM manipulation is hard to beat. But the moment you ask them to process data changes through their non-React internals, they lose their appeal.
Kendo is a genuine React component that somehow manages to be terrible at loading, but not so bad at updates. Syncfusion crashes on large datasets and cheats on scrolling. DevExtreme Gantt is the slowest at almost everything and catastrophically bad at CRUD. If you’re evaluating these for a production app, save yourself the trial period.
What I Didn’t Test
One big thing is missing from this review: scheduling logic. Auto-scheduling – where the engine resolves dependencies, respects constraints, recalculates critical paths – is arguably the most important feature of a Gantt chart after raw rendering.
It’s a completely different kind of workload. A library that’s slow at rendering might have a brilliant scheduling engine, or vice versa. The results could look very different from what you’ve seen above.
This is where Bryntum Gantt could redeem itself. They market their Gantt as having the most advanced scheduling capabilities on the market, and that claim deserves a proper test, not a dismissal based on rendering benchmarks alone.
I’m planning to run a dedicated scheduling performance comparison: same libraries, same datasets, focused purely on how fast and how correctly they resolve task dependencies and constraints. When it’s done, I’ll share the results.
Wrapping Up
If you’re building a project management tool with React and need to handle fast updates and large datasets, the choice is clear: React-first architecture matters. SVAR React Gantt is the fastest Gantt chart library in the categories of loading speed, CRUD operations, and live updates. And as for the feature set, we’re actively working on adding more in our upcoming updates. Stay tuned!