

Introduction
If you’re building a scalable React application with a complex architecture and production requirements, you’ll likely choose Next.js for routing, server-side rendering (SSR), SEO-friendly pages, and a batteries-included setup.
The State of JS 2025 survey shows that Next.js (by Vercel) remains one of the most popular React meta-frameworks for building production-grade web applications. Despite the polarizing opinions and plenty of critical feedback from developers, almost 60% of respondents report that they’ve used it in their workflow.
So if you’re building a project management dashboard, a timeline of processes, or a construction app, chances are you’re using Next.js. And when you need an interactive scheduling interface on top of that, SVAR React Gantt Chart is a solid out-of-the-box solution.
In this tutorial, we’ll integrate SVAR Gantt into a Next.js project (App Router) and handle the common integration issues you’ll hit along the way.
Why SVAR React Gantt
Building a Gantt from scratch typically requires weeks of development time just for basic features. With SVAR Gantt, you can get an interactive Gantt chart with essential functionality in 20 minutes with fast, battle-tested performance.
SVAR React Gantt is a strong fit for project and timeline visualization in Next.js apps. Here’s why:
- Free and PRO editions: the free, open-source core of SVAR Gantt allows you to build a fully-functional Gantt chart with basic task management. The PRO Edition adds auto-scheduling logic, critical path support, baselines, markers, and more.
- Native React: the component is written in React and doesn’t need any wrappers to integrate into React and Next.js projects
- High-performance: SVAR Gantt handles thousands of tasks with lightning speed - check the demo with 10,000 tasks
- Built for developers: TypeScript support, detailed docs, and a flexible API help you implement and customize Gantt charts faster.
What We’ll Build
Time estimate: 20 minutes
Difficulty: Beginner to intermediate
Prerequisites: Basic Next.js and React knowledge
Demo code: Full source on GitHub
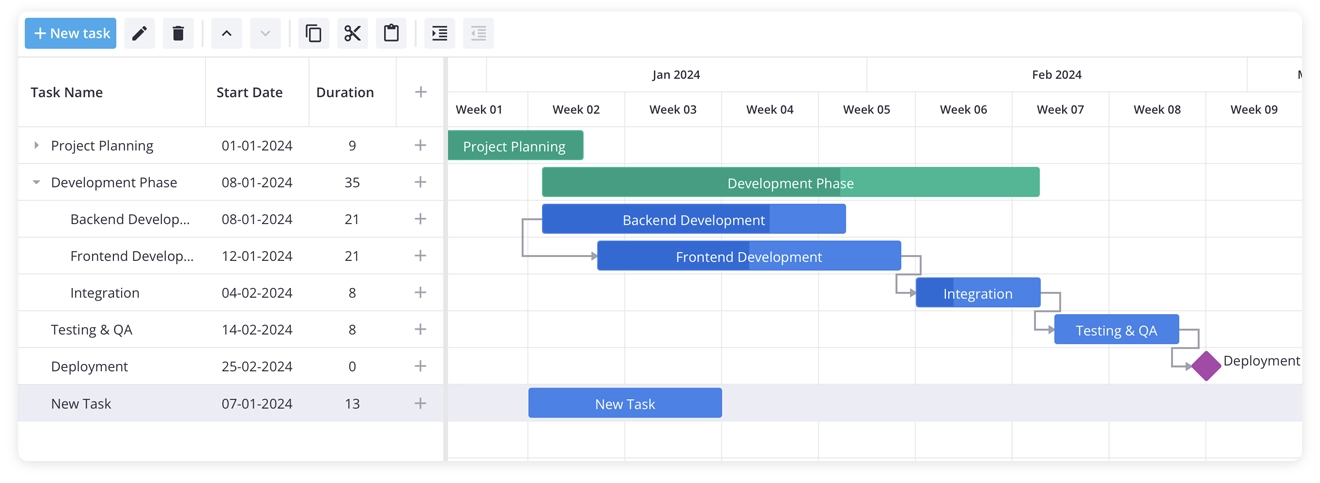
By the end of this tutorial, you’ll have a production-ready Gantt chart in Next.js that lets users:
- add, edit and delete tasks and dependencies
- drag-and-drop and resize tasks on the timeline
- edit tasks via an edit form
- reorder tasks in the grid
- use the built-in toolbar on top to manage tasks
We’ll build it step by step, encountering and solving common issues along the way. This is the Gantt chart interface we’ll build in the end of the tutorial:
Creating the Project
We start by creating a new Next.js application, using the standard code:
npx create-next-app@latest my-gantt-app --typescript --tailwind --app --src-dircd my-gantt-appThen we need to add the SVAR Gantt package, which can be installed from npm:
npm install @svar-ui/react-ganttNote: for this tutorial we’re using the free, open-source version of SVAR React Gantt. For the PRO or Trial edition, follow these installation instructions.
Adding the Gantt Component
Once the package is installed, we can import the Gantt chart component. We’ll need a client component for this since Gantt relies on browser APIs and cannot run during SSR.
Let’s create a TypeScript file src/app/components/GanttChart.tsx:
"use client";
import { Gantt } from "@svar-ui/react-gantt";
const tasks = [  {    id: 1,    text: "Project Planning",    start: new Date(2024, 0, 1),    end: new Date(2024, 0, 10),    progress: 100,    type: "summary",    open: true,  },  {    id: 2,    text: "Requirements Gathering",    start: new Date(2024, 0, 1),    end: new Date(2024, 0, 5),    progress: 100,    parent: 1,  },  // ... more tasks];
const links = [  { id: 1, source: 2, target: 3, type: "e2s" },];
const scales = [  { unit: "month", step: 1, format: "%M %Y" },  { unit: "week", step: 1, format: "Week %w" },];
export default function GanttChart() {  return (    <div style={{ height: "600px", width: "100%" }}>      <Gantt tasks={tasks} links={links} scales={scales} />    </div>  );}
Let’s also update the src/app/page.tsx file to display our Gantt chart component:
import GanttChart from "./components/GanttChart";
export default function Home() {  return (    <div className="h-screen flex flex-col">      <header className="p-6">        <h1 className="text-3xl font-bold">My Gantt Chart</h1>      </header>      <main className="flex-1 min-h-0">        <GanttChart />      </main>    </div>  );}
If you run npm run dev, you can see that the Gantt component renders, but elements are misaligned and there’s no proper styling.
So it’s time to add the CSS file now to give the chart its clean, modern look.
Adding Styles
To add component’s CSS, update our imports in GanttChart.tsx:
"use client";
import { Gantt } from "@svar-ui/react-gantt";import "@svar-ui/react-gantt/all.css";
Note that the SVAR Gantt package provides two CSS files:
- all.css - includes all styles that are necessary for the Gantt chart.
- style.css - doesn’t include styles for other SVAR components that are used inside of the Gantt (such as DataGrid, Editor, etc.) You can use it if you want to optimize the bundle size.
In our demo we’re adding all.css to keep all the styles.
If you refresh the page, the layout renders correctly, but the default theme hasn’t been applied — so the chart appears without colors or proper visual hierarchy.
Adding the Theme
SVAR components use a theme provider for visual styling consistent for the whole SVAR React component library. Two themes are supported: light and dark. For our demo we choose the light one - Willow theme.
So now we need to wrap our Gantt with this Willow theme:
"use client";
import { Gantt, Willow } from "@svar-ui/react-gantt";import "@svar-ui/react-gantt/all.css";
// ... tasks, links, scales definitions ...
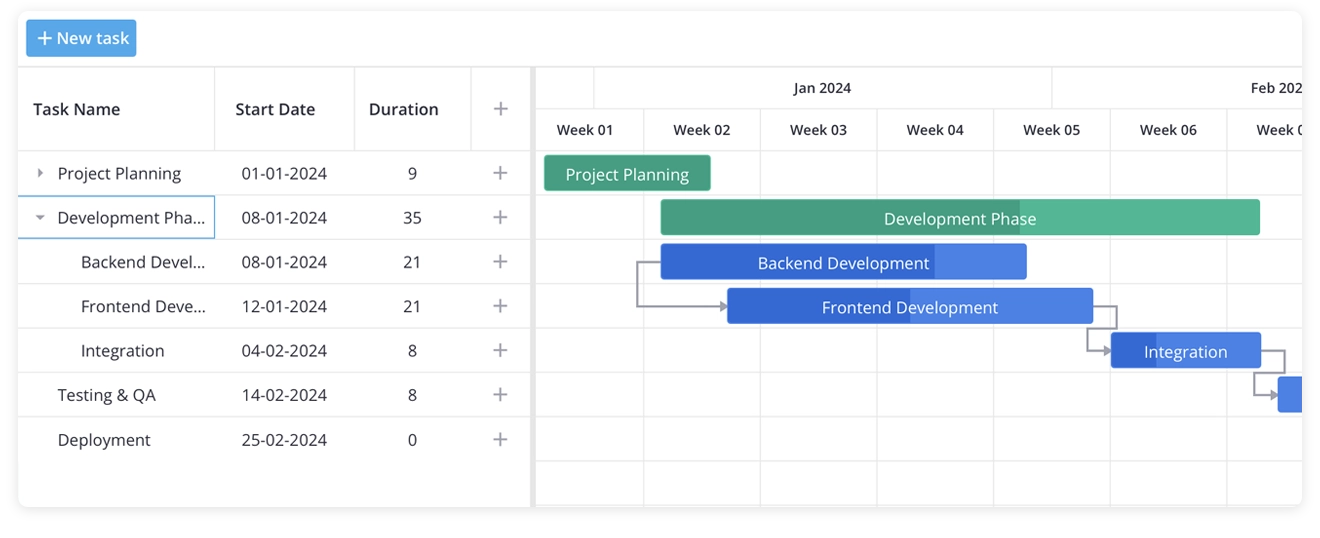
export default function GanttChart() { return ( <div style={{ height: "600px", width: "100%" }}> <Willow> <Gantt tasks={tasks} links={links} scales={scales} /> </Willow> </div> );}If you reload your page, you’ll see the Gantt chart fully styled with proper headers, colored task bars, and consistent visual hierarchy. Common tasks are colored with blue, summary tasks with green, and milestones - with purple color.
Fixing Layout for Full-Height Display
If you want the Gantt chart to expand and occupy the full available space instead of a fixed height, you may encounter layout issues. A common first attempt is setting the container’s height to 100%:
<div style={{ height: "100%", width: "100%" }}> <Willow> <Gantt tasks={tasks} links={links} scales={scales} /> </Willow></div>At this point, the chart may not stretch as expected. The reason is that the theme wrapper itself needs an explicit height. To fix this, just add a CSS rule:
.wx-theme { height: 100%;}The .wx-theme class is used internally by SVAR theme providers. Without a defined height, it defaults to content-based sizing, which breaks the percentage-based layout chain.
For a full-page layout, ensure the root HTML elements also have proper sizing:
html,body {  height: 100%;  margin: 0;}
.wx-theme {  height: 100%;}
With these changed, the Gantt chart should now properly fill its container.
Understanding Hydration Warning
With everything working nicely, you might notice a warning appearing in the browser console:
A tree hydrated but some attributes of the server rendered HTMLdidn't match the client properties.But there is no need to worry, it’s actually not a bug. Here’s what’s going on:
SVAR Gantt calculates its layout dynamically based on the container’s size. During server-side rendering, there’s no real DOM to measure, so the server uses default values. Once React hydrates on the client, it recalculates sizes with the actual browser dimensions, leading to a mismatch notice.
Despite the warning, the chart itself renders correctly — the client-side layout overrides the temporary server render.
How to Handle This Warning
Option 1: Ignore it
The component functions normally. The console warning is harmless and only indicates a brief adjustment of dimensions during hydration. So if a console warning doesn’t bother you, just ignore it.
Option 2: Client-only rendering
If you prefer a clean console, you can delay rendering until the component mounts on the client:
"use client";
import { useState, useEffect } from "react";import { Gantt, Willow } from "@svar-ui/react-gantt";import "@svar-ui/react-gantt/style.css";
// ... tasks, links, scales definitions ...
export default function GanttChart() {  const [mounted, setMounted] = useState(false);
  useEffect(() => {    setMounted(true);  }, []);
  if (!mounted) {    return <div style={{ height: "100%", width: "100%" }} />;  }
  return (    <div style={{ height: "100%", width: "100%" }}>      <Willow>        <Gantt tasks={tasks} links={links} scales={scales} />      </Willow>    </div>  );}
This renders an empty placeholder during SSR. After mounting, the chart appears with correct dimensions and no warning.
The tradeoff here is a brief empty state before the Gantt appears, versus the warning with immediate (slightly adjusting) content. You can choose which approach suits your preferences.
Enabling Task Edit Form
At this point, we have a Gantt chart that displays tasks correctly, but they are read-only. Users can’t edit the task name, adjust dates, or change any task details.
To enable task editing, we’ll add a side panel powered by SVAR React Editor component. This component integrates directly with the Gantt instance and provides a structured form for modifying task properties.
The Gantt component exposes its internal API through an init callback. By capturing that API reference, we can connect it to the Editor component:
"use client";
import { useState, useEffect } from "react";import { Gantt, Willow, Editor } from "@svar-ui/react-gantt";import "@svar-ui/react-gantt/all.css";
// ... tasks, links, scales definitions ...
export default function GanttChart() {  const [mounted, setMounted] = useState(false);  const [api, setApi] = useState(null);
  useEffect(() => {    setMounted(true);  }, []);
  if (!mounted) {    return <div style={{ height: "100%", width: "100%" }} />;  }
  return (    <div style={{ height: "100%", width: "100%" }}>      <Willow>        <Gantt tasks={tasks} links={links} scales={scales} init={setApi} />        {api && <Editor api={api} />}      </Willow>    </div>  );}
What’s happening in this setup?
init={setApi}— when the Gantt component initializes, it passes its API object to our state setter.{api && <Editor ... />}— the Editor component requires the API to function, so we only render it once the API is available.Editor— renders a side panel that appears when a task is selected, allowing users to modify its properties.
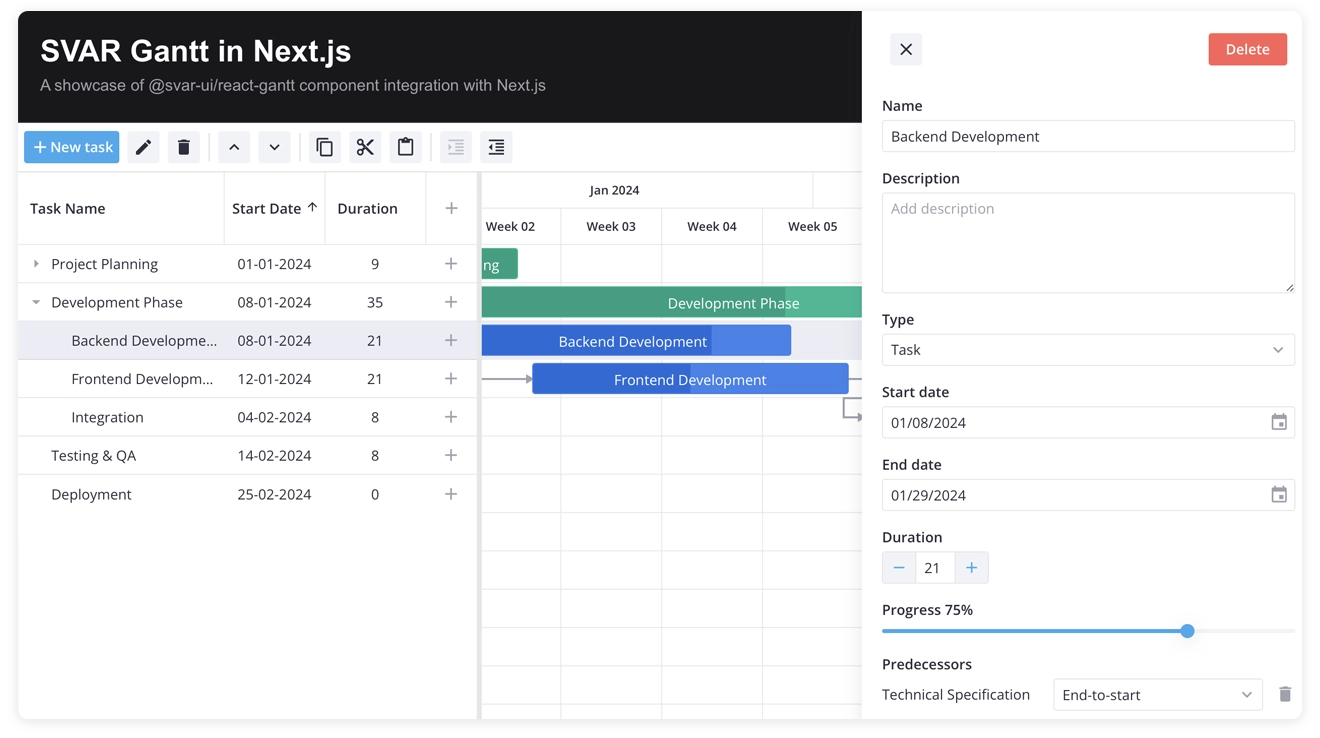
Now, when a user double-clicks a task, a side panel appears. From there, they can edit the task name, description, start and end dates, progress, and other configurable fields.
Below is an example of the editor panel in action:
This is all for now. We’ll explain the next steps of integrating SVAR React Gantt with Next.js in the follow-up tutorial.
What We’ve Built
In this tutorial, we integrated SVAR React Gantt into a Next.js (App Router) project and configured:
- Client-side rendering for browser-dependent components
- Proper layout handling for full-height containers
- Theme setup using the Willow provider
- Hydration-safe rendering in a Next.js SSR environment
- Built-in task editing with the Editor side panel
Following this article, you’ll have a fully functional, interactive Gantt chart running inside a Next.js application.
If you want to go deeper into the customizing the Gantt chart and explore more advanced configuration options, check the documentation for: task data structure, dependencies, customizing the editor, localization.
For any questions about the integration, feel free to use our forum.
What We’ll Cover Next
In the next part “Building a Gantt Chart in Next.js: Backend” we’ll move beyond static arrays and build a real backend layer. We’ll cover:
- Creating API routes in Next.js
- Persisting tasks and links in a database
- Synchronizing changes between the Gantt and the server
- Adding a toolbar for task management actions
This will turn the Gantt from a demo component into a production-ready scheduling module.
And if SVAR Gantt helps in your project, consider starring the repository on GitHub. It helps other developers discover the project and keeps us motivated ⭐