

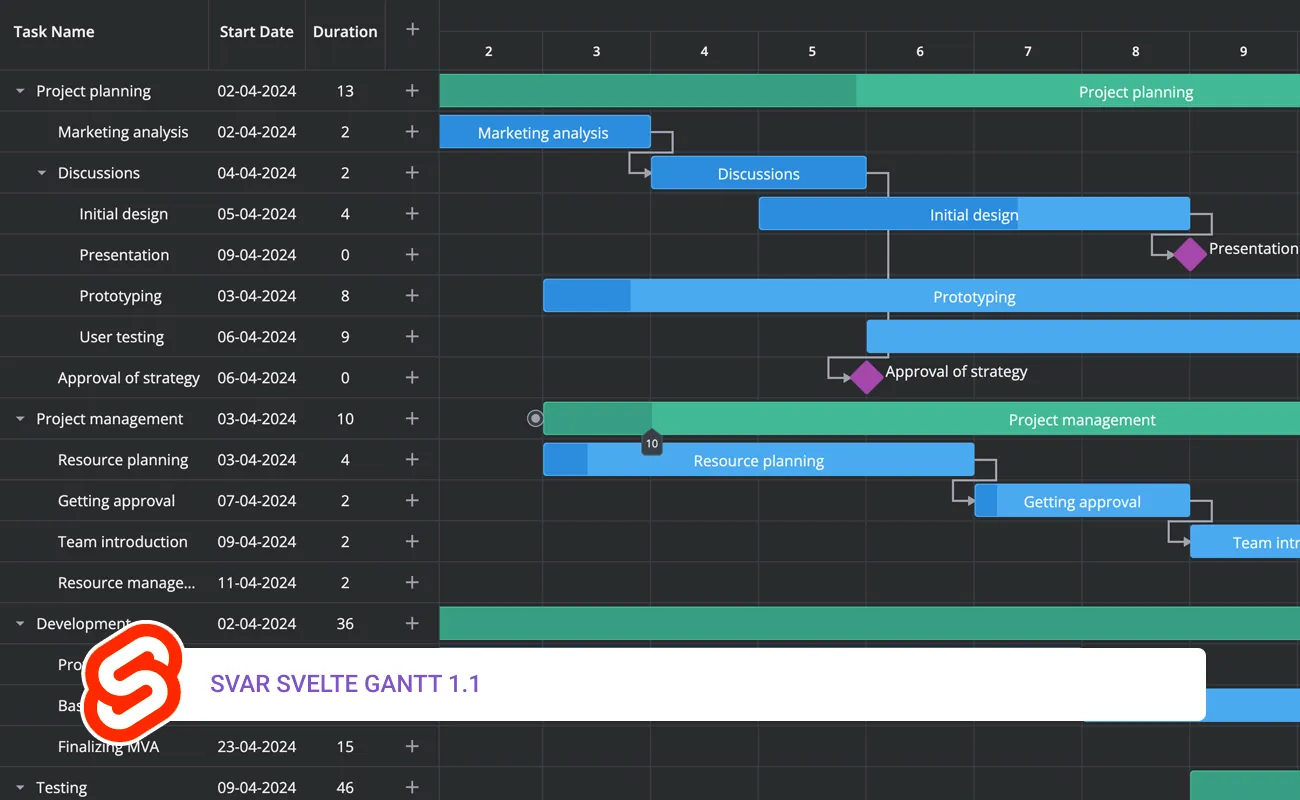
We’re excited to present the update of SVAR Svelte Gantt chart component. The new version brings several powerful features, such as:
- A new summary task type,
- The ability to sort tasks in grid,
- More control over the zooming functionality,
- UI improvements for context menu and toolbar,
- Batch request mode for RestDataProvider to enhances performance during mass data operations,
- Some significant fixes for improved stability.
This update not only makes SVAR Gantt more reliable but also a joy to use for your end users. Below is the detailed overview of the new features and available fixes:
Summary Tasks
The new summary task type has been added and now can be used for more intuitive visualization of projects or threads of sub tasks. The summary tasks auto-adjust their start, end and duration depending on tasks within them. Also, if the user drags the summary task bar on the time scale, all the child tasks are shifted accordingly.
Here is how you can add a summary task to your Gantt chart:
const data = [ { id:1, text:"Top project", type: "summary", …}, // other tasks];The default behavior of the summary tasks can be easily modified or extended using SVAR Gantt’s API. For example, you can automatically calculate and show progress based on the child tasks or convert all tasks with children to summary tasks and back on the fly (see the related docs).
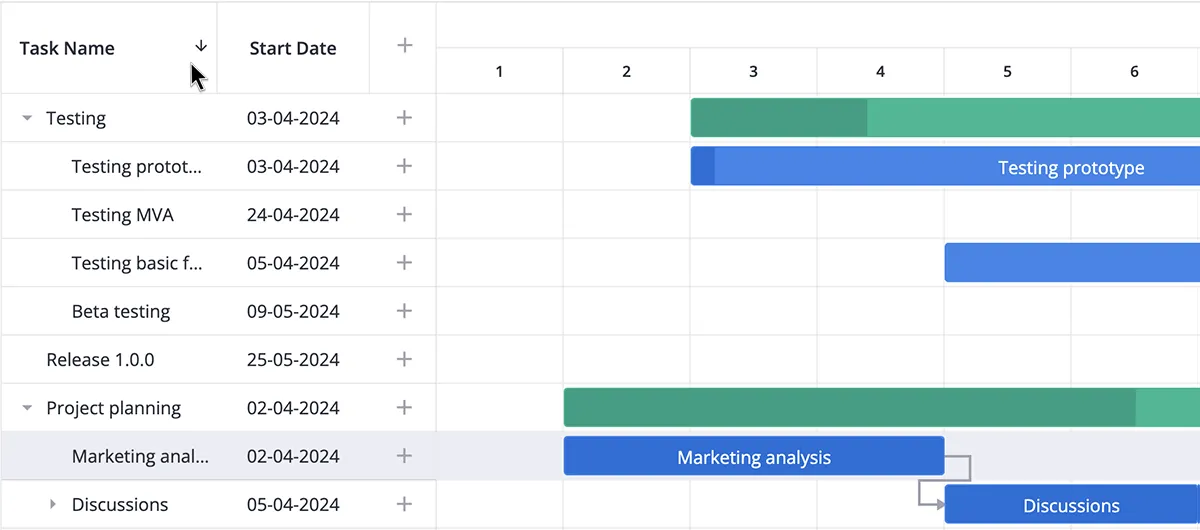
Sorting Grid Columns
SVAR Svelte Gantt v1.1 now supports task sorting within the grid by simple click on a column header. This feature allows users to quickly organize tasks based on any column, making it easier to manage and view task details.
Flexible Zoom Control
We’ve introduced new properties, minCellWidth and maxCellWidth, in the top-level zoom configuration. These properties set the minimum and maximum width for all zoom levels, making it easier to configure custom zoom settings.
This update ensures that the Gantt chart remains clear and well-structured at any zoom level, improving readability across different screen sizes while giving you more control over the chart’s visual presentation.
Improved Toolbar and Context Menu Behavior
In this update, we’ve introduced a helpful UI improvement: toolbar and context menu items are now dynamically disabled for actions on tasks that can’t be performed. For example, the “move up” option will be disabled for the topmost task and “move down” for the last task in the list.
Batch Request Mode for RestDataProvider
In this release, we’ve also added the new batch request mode to the RestDataProvider, a ready-to-use service that simplifies data updates and data binding with the backend. It’s now possible to send multiple requests to the server by grouping them into one batch request. These requests can involve different operations, such as actions on different entities (links, tasks with various IDs), or different types of operations (delete, add, update).
When the user performs multiple actions simultaneously on the Gantt chart, instead of sending individual requests one by one, RestDataProvider groups them into a single batch request. For individual actions, the requests continue to be processed as usual.
To enable the batch mode in the RestDataProvider, you need to specify the batchURL in the constructor. This route is where the consolidated POST requests will be sent:
new RestDataProvider( "https://master--svar-gantt-go-project.io", { batchURL: "batch" } );For more details, see this article in the docs.
Fixes and Improvements
In this update, several important fixes have been made to improve the usability and performance of the SVAR Gantt Chart. These include resolving issues with zooming between levels and correcting the behavior of adding tasks based on the target position.
We’ve also addressed problems with milestone tasks affecting the auto-scaling, fixed bugs in the task update process that caused data loss, and improved the handling of third-level task indentation.
Additionally, improvements have been made to the resizing of columns, handling of scrollbars, and the stability of moving tasks within nested hierarchies in the grid. You can find the full list of what’s new in the documentation.
Get Started with Svelte Gantt Chart v1.1
All in all, the new version makes SVAR Svelte Gantt a more stable and feature-rich solution for creating professionally looking Gantt charts. With the latest RestDataProvider enhancements, the Gantt chart now handles the editing of large data volumes more efficiently, improving overall performance for users working intensively on complex projects.
Learn more about SVAR Svelte Gantt chart or jump to the getting started guide, and see if it fits your project!