

Updated in January 2026
In this article we are going to compare React Gantt Charts - project planning visualization solutions that help manage tasks and allocate resources efficiently. Since we have already launched and continue upgrading our own project management library - SVAR React Gantt - staying updated on available solutions is essential.
As the complexity of enterprise projects grows, the need for feature-rich tools capable of handling multiple processes increases. As a result, Gantt charts, with their ability to visually represent tasks, timelines, and interdependencies, have naturally become more popular.
But what makes them such a go-to solution for businesses? The answer lies in their ability to simplify project management and provide managers with convenient instruments for:
- Creating a visual overview of a project;
- Designing a plan of action easy to understand and follow;
- Tracking tasks progress;
- Administering resources;
- Building efficient communication between team members;
- Ensuring transparency of the processes;
- And finally assessing the achieved results.
Usually modern Gantt chart libraries contain a wide range of functionalities to meet the requirements of both small and large-scale companies. However, the feature sets offered by the existing solutions can differ. This is the reason why it becomes so challenging to decide on a specific one.
Let’s have a look at the list of React Gantt Charts we have chosen for our analysis and see how they compare in terms of features, flexibility, and usability.
SVAR React Gantt Chart
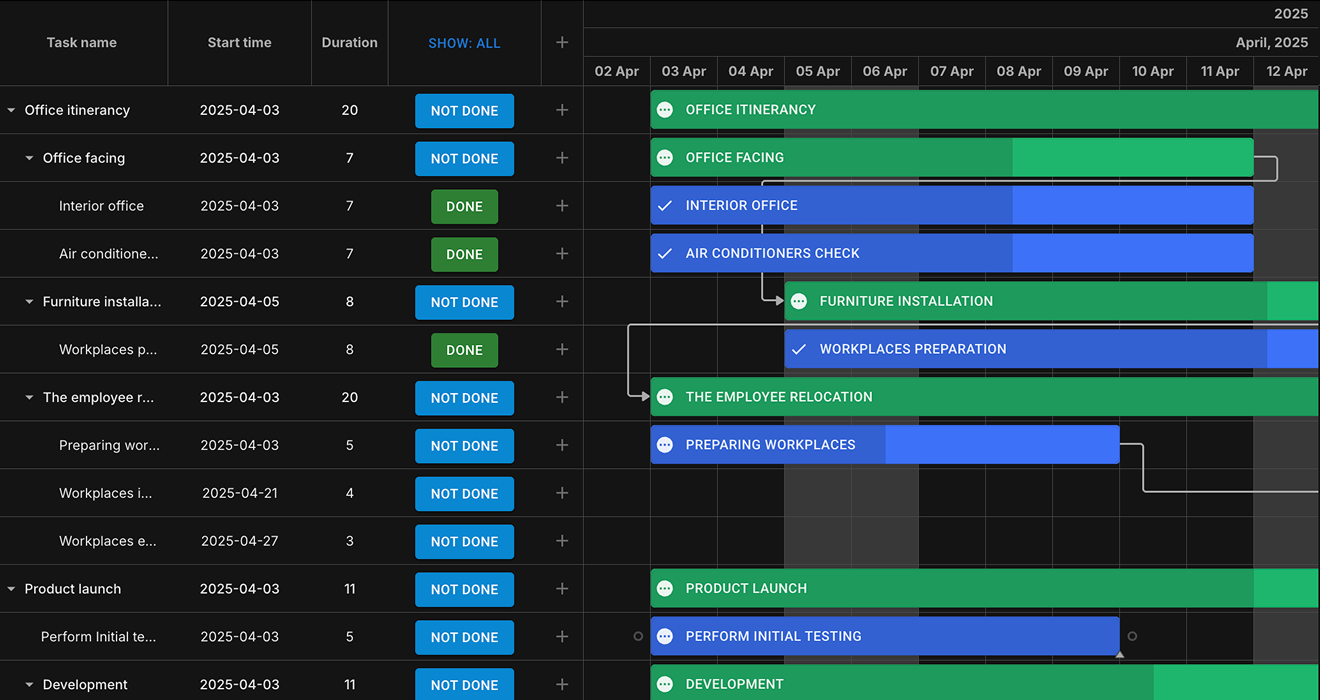
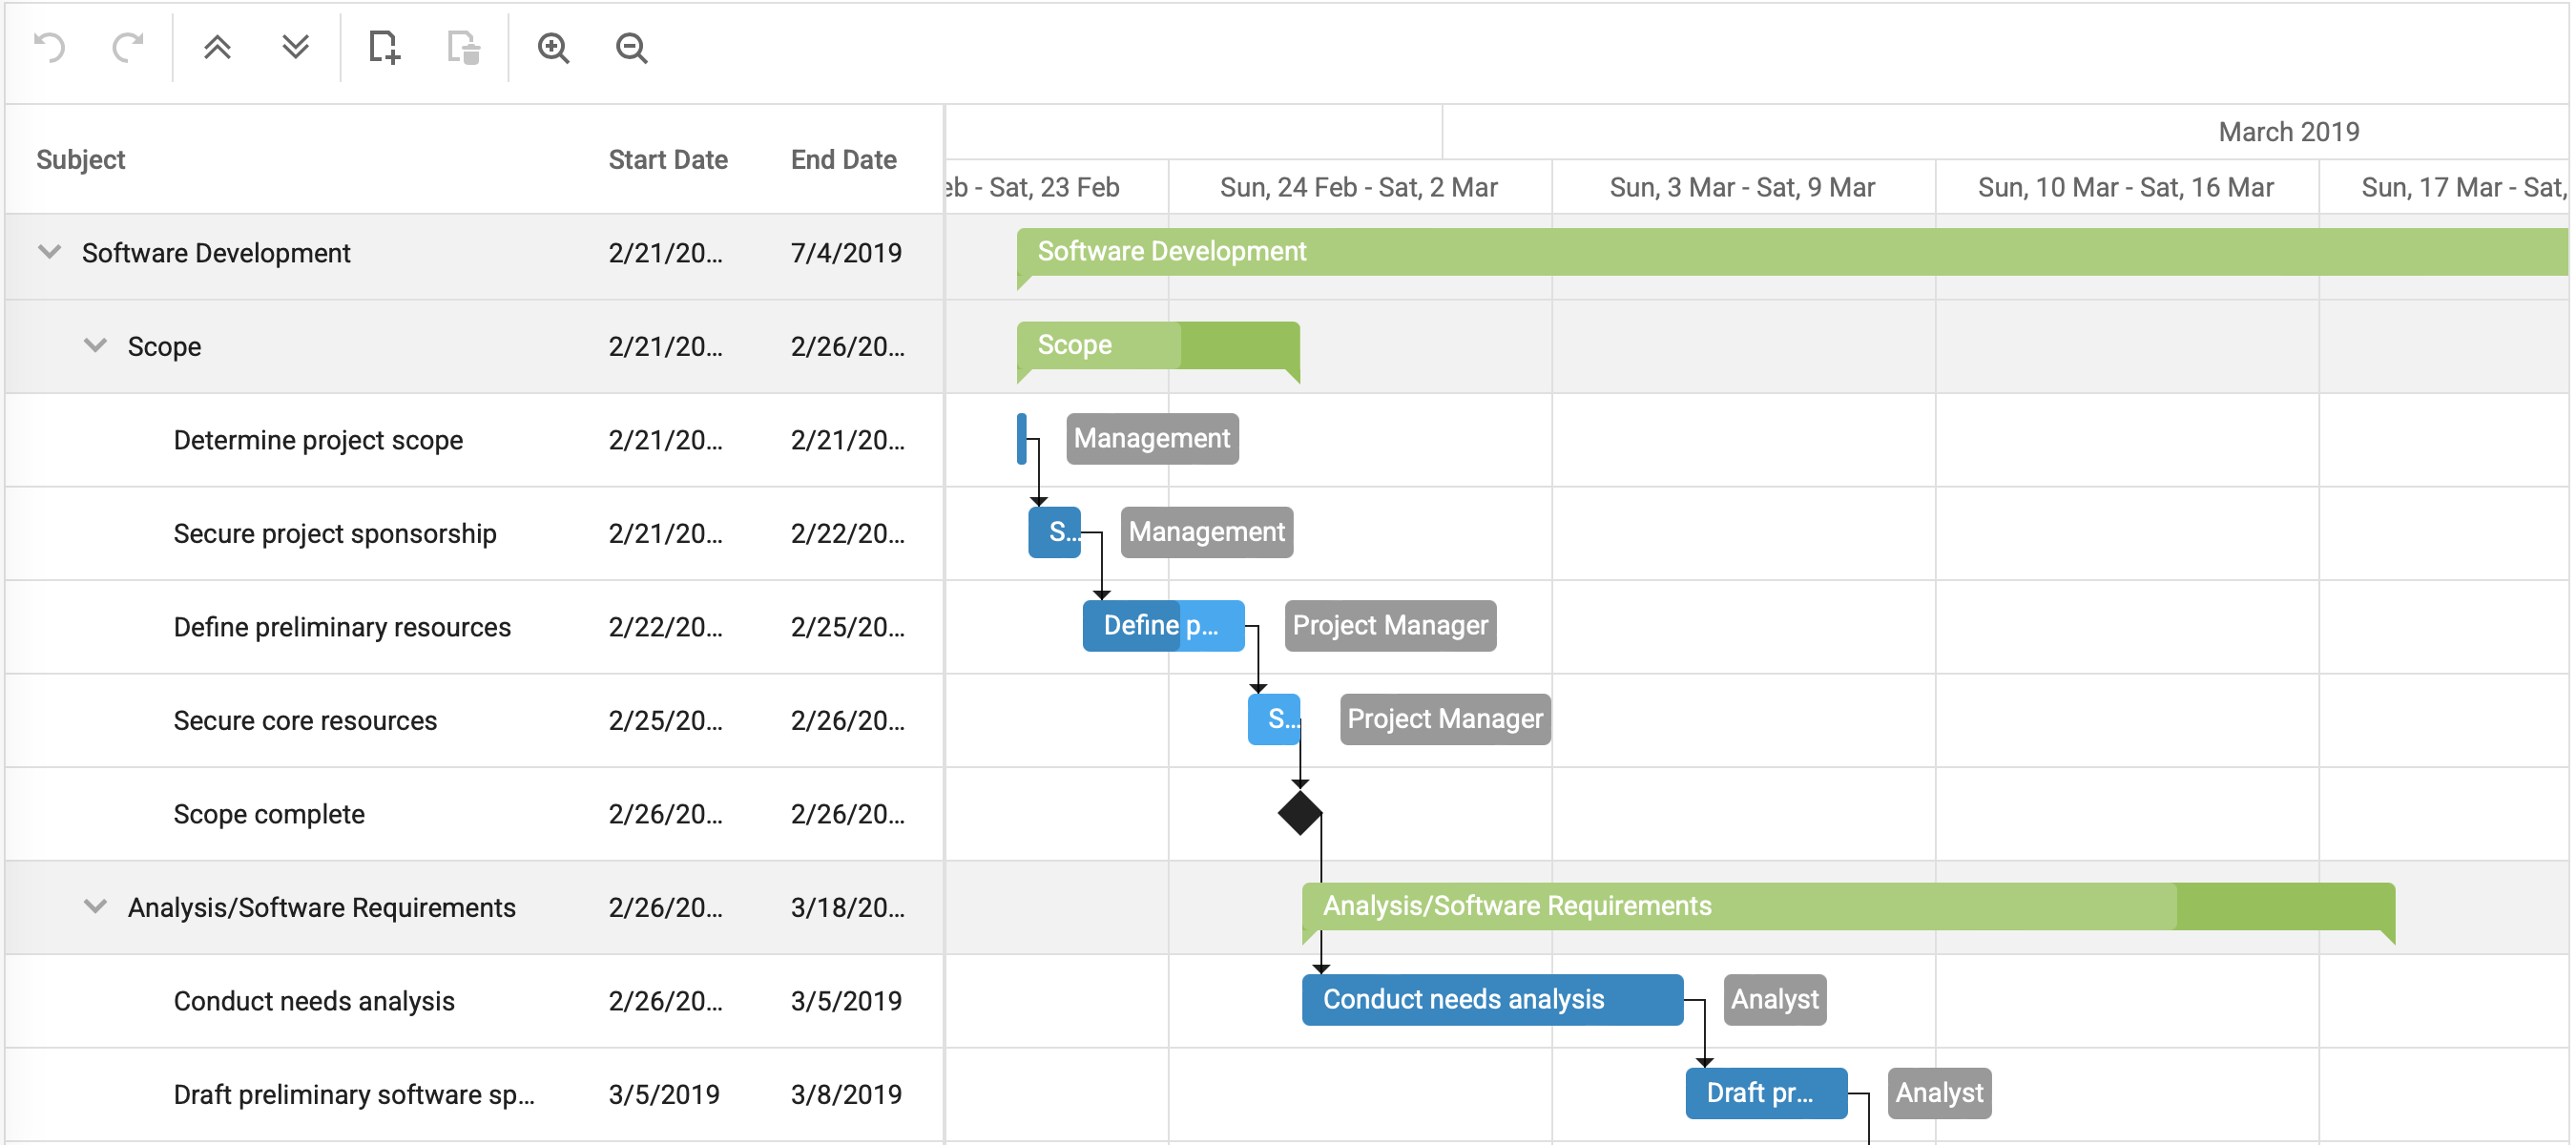
SVAR React Gantt Chart is a React Gantt library distributed under the open-source MIT License, which means it can be freely used in both open-source and commercial projects. The source code is available on GitHub and is actively maintained with regular updates.
The component is well-designed and incorporates a rich feature set, providing responsive and interactive Gantt chart interface out-of-the-box. Starting with v.2.4, a PRO Edition is also available, adding more complex scheduling logic and enterprise-level features: auto-scheduling, split tasks, critical path, non-linear calendar, data export and more.

SVAR React Gantt Chart comes with a well-organized documentation that provides all necessary guides, API references and demos. Users also can get support through the community forum, where the SVAR team provides timely assistance.
SVAR React Gantt’s key features:
- Interactive UI - tasks and dependencies can be modified using drag-and-drop;
- Task dependencies: end-to-start, start-to-start, end-to-end, start-to-end;
- Operations with tasks (creating, editing, deleting);
- Sorting by a single or multiple columns;
- Customizable time scale and task bars;
- Built-in toolbar and context menu;
- Task tooltips;
- Hotkeys;
- Zooming;
- Localization;
- Highlighting weekends and holidays;
- Light and dark themes;
- RestDataProvider service that helps automate backend data binding;
- MCP Server for AI-assisted development.
SVAR React Gantt offers multiple demos showcasing its features, allowing users to explore its latest capabilities in an interactive environment.
Strong points:
- Open-source core with a free MIT license;
- Optimized performance for large data sets - demo with 10k tasks;
- Native React integration (no wrappers around legacy code);
- Comprehensive documentation with interactive demos;
- MCP server for AI-assisted coding.
The library can be easily installed via npm:
npm install @svar-ui/react-ganttDHTMLX Gantt for React
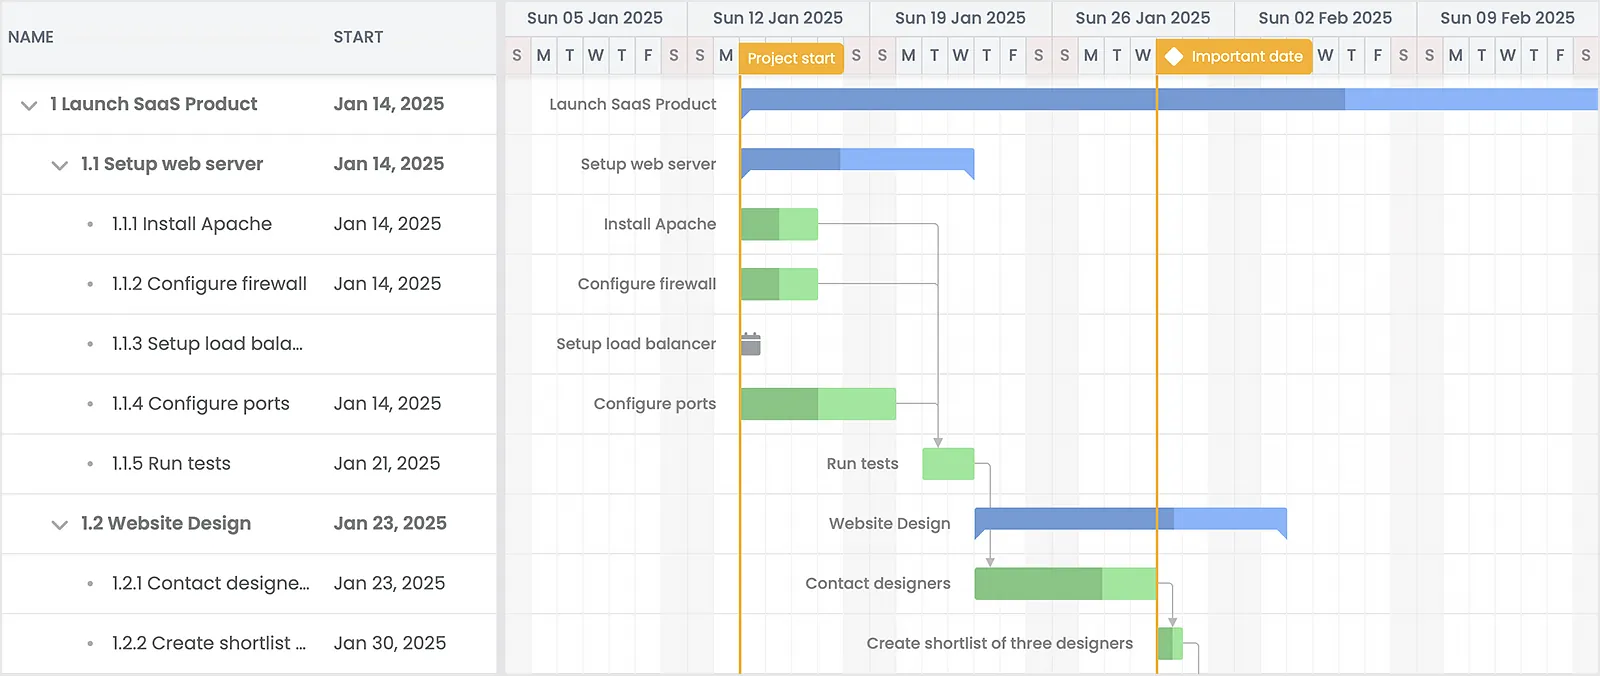
DHTMLX Gantt for React is a professional enterprise-grade UI component designed to meet complex project management needs in large-scale solutions. The extensive, React-friendly API of this tool allows for a flexible setup using multiple configuration and customization options. It is distributed under a commercial license, with a free 30-day trial version available for evaluation.
DHTMLX Gantt for React key features:
- Auto-scheduling and dependency recalculation for intelligent project planning
- Workload allocation with load charts, histograms, and grouping tasks
- Time constraints
- Working time calendars
- Baselines and deadlines
- Inline editors
- Editing history management with undo/redo
- Task and resource filtering
- Unscheduled and split tasks
- Vertical marker in the timeline area
- Customization with React components
- Export to PDF, PNG, Excel, and MSP
The well-structured documentation provides clear instructions with code snippets on how to get started with DHTMLX Gantt for React, feature descriptions, as well as integrations with popular React libraries.
Strong points:
- Smooth rendering of large enterprise projects with 30,000+ tasks
- Integration with Redux and SSR frameworks (Next.js and Remix)
- Full support for JSX and TSX
- Simple styling powered by MUI compatibility
- Suitable for mission-critical SaaS React applications
You can install DHTMLX React Gantt via npm and yarn. Here is how to start with the trial version:
npm install @dhtmlx/trial-react-ganttyarn add @dhtmlx/trial-react-ganttBryntum Gantt Chart
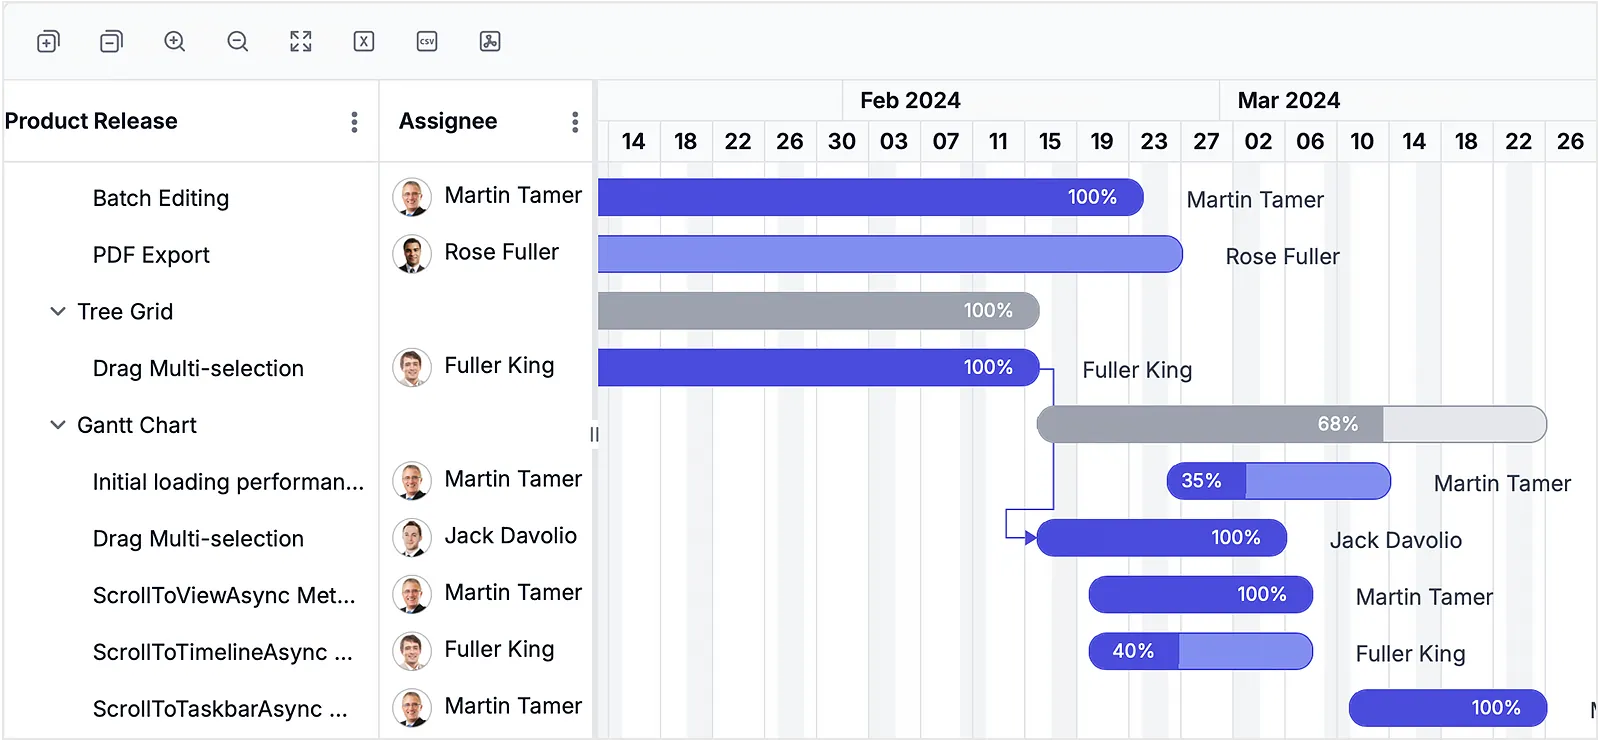
Bryntum Gantt is a JavaScript Gantt chart component that comes with a React wrapper. This wrapper facilitates Gantt’s integration into a React project and gives you full access to Bryntum API widget class configs, properties, events, and features.
Bryntum Gantt’s key features:
- Advanced filtering and sorting;
- Tasks grouping;
- Task dependencies and constraints;
- Inactive tasks and dependencies;
- Programmatic validation;
- Undo/redo features;
- Support for real-time updates;
- Split tasks;
- Export to PDF, PNG and Excel;
- Rollups of tasks;
- Fully customizable UI elements;
- Interactive drag-and-drop interface;
- Multiple themes.
Users benefit from detailed documentation and numerous examples covering both basic and advanced configurations.
Strong points:
- Codebase in JavaScript and TypeScript with a wrapper for React;
- Standalone scheduling engine;
- Large data sets support;
- Reactive API;
- Provides AI integration points for text generation, natural language filtering, and project insights
- Extensive feature set.
The component is distributed under the commercial license (the pricing starts from $940 per developer), so you will need to configure npm and log in to install Bryntum Gantt package - both the trial and licensed versions require configuring and logging in. After completing these steps you can choose one of the following options:
// in case you use JavaScriptnpm create vite@latest bryntum-gantt-app -- --template react
//in case you use TypeScript npm create vite@latest bryntum-gantt-app -- --template react-ts
In addition to the React wrapper, Bryntum provides wrappers for Angular and Vue, contributing to smooth integration with the main frontend frameworks.
Syncfusion React Gantt Chart
Syncfusion React Gantt Chart is another React Gantt component. It comes as part of the Syncfusion Essential Studio and offers several commercial licensing options (Project, Global and Division) – the pricing is provided upon request. There is also a community license for startups but it’s available under certain strict conditions.
Syncfusion React Gantt Chart key features:
- Interactive drag-and-drop interface;
- Task types and dependencies;
- Configurable timeline;
- Resource view;
- Splitting/merging tasks;
- Filtering, including Excel like filter;
- Undo/redo feature;
- Events and days highlights;
- Built-in themes and animation;
- Zooming;
- Critical path;
- Export to PDF, CSV, Excel.
You can find the description of all the available features with their demos here.
Strong points:
- Optimized performance;
- Seamless data binding;
- Availability of the free community license (for small companies and startups);
- Online Theme Studio tool for themes customization;
- MCP server for AI assistants;
- AI-driven demos (task prioritization and prediction of milestone task completion).
You can add the Gantt chart to your React project via npm:
npm install @syncfusion/ej2-react-gantt --saveAlongside with the React suite, Syncfusion offers to the users Angular and Vue suites with the Gantt chart.
DevExtreme React Gantt
DevExtreme React Gantt is part of the DevExtreme React UI Components library. It is distributed under the commercial license within the DevExtreme Complete package - the price starts from $899.99 per developer.
DevExtreme React Gantt key features:
- The possibility to modify and move tasks with drag-and-drop;
- Single and multiple columns sorting;
- Filtering with a pop-up menu;
- Customizable task elements;
- Strip lines for highlighting time intervals;
- Context menu for tasks;
- Toolbars and tooltips support;
- Export to PDF.
You can find the description of the available features accompanied by demos here.
Strong points:
- Cross-platform and mobile-friendly;
- Templates for customizing UIs;
- Validation of relationships between tasks;
- High performance with large datasets;
- Universal data binding;
- MCP server for DevExtreme documentation.
To add the Gantt chart to your app, you need to install and configure DevExtreme first. This can be done with the help of the following command:
npx -p devextreme-cli devextreme add devextreme-reactThen you will require some imports for adding the chart to your project:
import 'devextreme/dist/css/dx.light.css';import 'devexpress-gantt/dist/dx-gantt.min.css';
import { Gantt } from 'devextreme-react/gantt';
Angular, Vue and JQuery Gantt chart solutions are also available in the corresponding DevExtreme suites.
Comparison Table
Let’s now have a look at the summary table that will help us understand the pros and cons of the listed charts even better. It includes some characteristics that can play a crucial role when selecting a Gantt chart for the project.
| Feature | SVAR Gantt | DHTMLX Gantt | Bryntum | Syncfusion | DevExtreme |
|---|---|---|---|---|---|
| Pure React | ✔️ | Wrapper | Wrapper | Wrapper | ✔️ |
| Drag-and-drop UI | ✔️ | ✔️ | ✔️ | ✔️ | ✔️ |
| Resource view | ✖️ | ✔️ | ✔️ | ✖️ | ✔️ |
| Configurable timeline | ✔️ | ✔️ | ✔️ | ✔️ | ✔️ |
| Critical path support | ✔️ | ✔️ | ✔️ | ✔️ | ✖️ |
| Baseline | ✔️ | ✔️ | ✔️ | ✔️ | ✔️ |
| Export of data | PDF, PNG, Excel, MS Project | PDF, PNG, Excel, iCal, MS Project, Primavera | PDF, PNG, Excel, MS Project | PDF, CSV, Excel | |
| Theme builder | ✖️ | ✖️ | ✖️ | ✔️ | ✔️ |
| Mobile-friendly | ✔️ | ✔️ | ✔️ | ✔️ | ✔️ |
| Price (from) | MIT/$524 | $699 | $940 | by request | $899.99 |
Honorable Mentions
These React Gantt chart libraries didn’t make the main list but are still strong contenders for specific use cases:
-
Telerik KendoReact Gantt (Commercial, from $749 per developer per year) - A customizable Gantt chart component with a basic functionality. Ideal if you’re already using KendoReact library but might not be enough if you need an advanced chart for your project timelines. KendoReact features AI integration, enabling code assistants, theme generation, and reporting insights through external AI services.
-
Smart React UI Gantt Chart is a high-performance project management component with zero dependencies and platform independence, distributed under the commercial license (from $399 per developer). The component features task editing via popup forms, resource timeline with diagram/histogram, and export to PDF, Excel, TSV, CSV. Includes 7 built-in themes and a Theme builder.
Final Thoughts
Choosing the right React Gantt chart depends on your project’s complexity, budget, and long-term maintenance needs. This comparison should serve as a practical starting point, but it’s always worth reviewing documentation, testing live demos, and validating how each library fits into your existing React setup.
If you’re looking for a fully open-source option with modern architecture and native React integration, SVAR React Gantt stands out as the only MIT-licensed solution on this list. It covers core project planning needs out of the box and can scale to more advanced scenarios through its PRO edition, without locking you into a commercial license from day one.